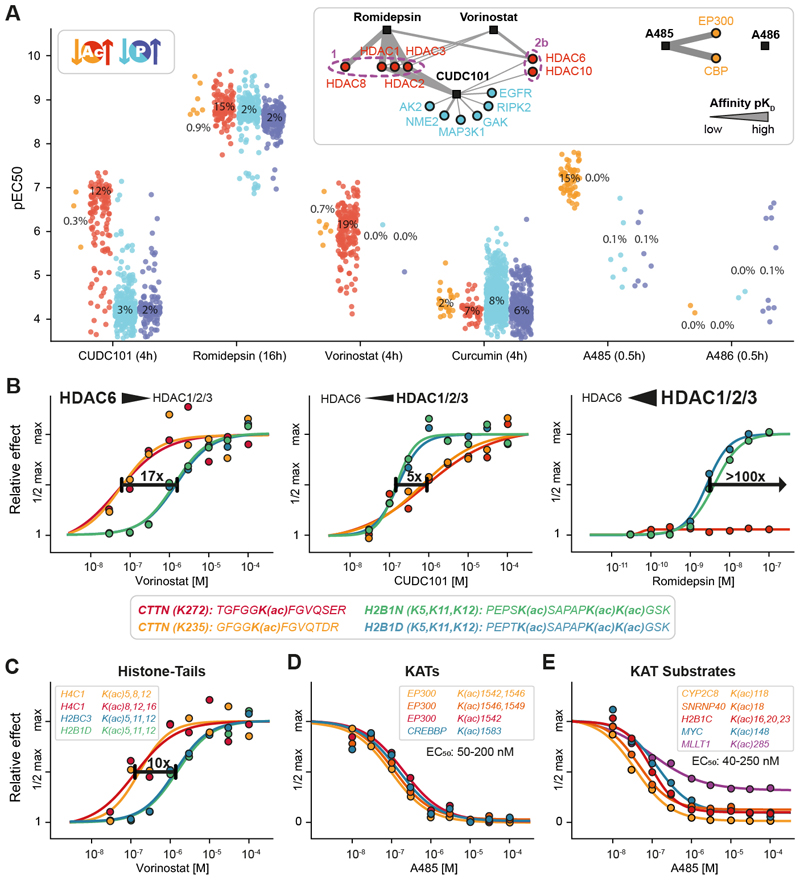
Fig. 3. Phosphorylation and acetylation decryptM signatures of epigenetic drugs delineate substrate preferences of KDACs and KATs.
(A) Strip plots of the cellular potency (pEC50) of drug-regulated acetylated (red) and phosphorylated peptides (blue). The insets show the affinity networks of targets engaged by the drugs determined by Kinobeads, KDAC-beads, or recombinant KAT assays. The strength of the line indicates the potency of drug:target interactions (apparent dissociation constant Kdapp;Table S2) (2, 16, 21). The treatment time is indicated in parenthesis next to drug names and percentages indicate the proportion of regulated PTM peptides vs. all PTM peptides measured in the assay. (B) Examples of cellular dose-response curves for three HDAC inhibitors illustrating the different potencies by which these drugs regulate cellular acetylation levels on cortactin or histones. (C) Same as panel B, but for several acetylation sites on histone tails. (D) Same as panel B, but for auto-acetylation sites on KATs after KAT inhibitor A485 treatment. (E) Same as panel B, but for known and putative novel KAT substrate acetylation sites.

