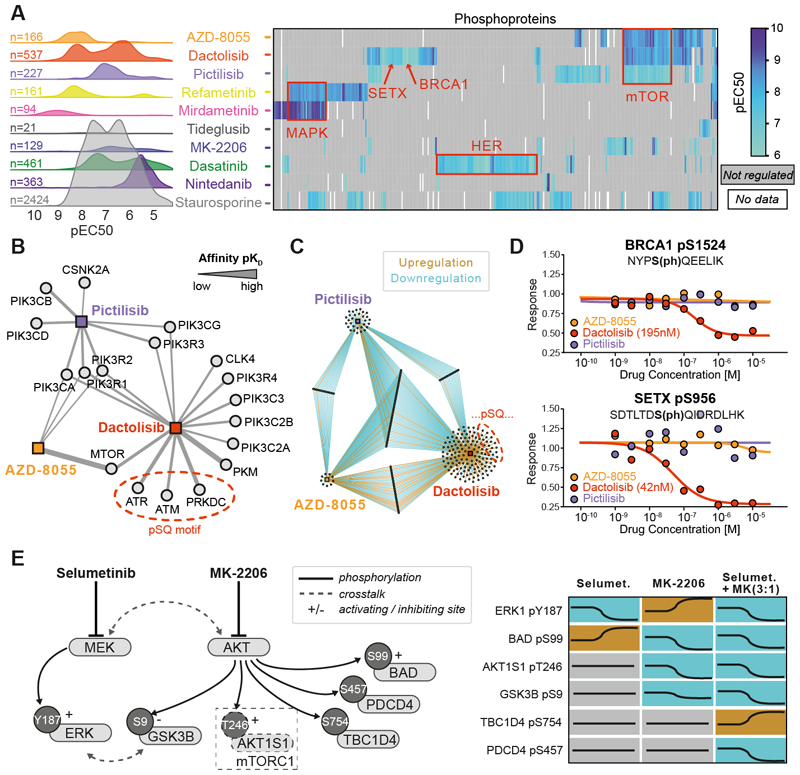
Fig. 4. DecryptM analysis of kinase inhibitors identifies drug-specific signatures and place phosphorylation sites into functional contexts.
(A) Left panel: decryptM- derived potency distribution plots of the number of phosphopeptides regulated by 10 kinase inhibitors in A549 cells. Right panel: pEC50 heatmap summarizing drug effects on annotated substrates of kinases or pathway members (red boxes). Not-regulated or missing values are shown in gray or white, respectively. (B) Affinity network (based on Kinobeads assays in pKD) of kinases inhibited by the three designated PI3K/mTOR inhibitors Pictilisib, AZD8055, and dactolisib. The strength of the line indicates the affinity of drug:target interactions (C) Network of phosphopeptides regulated by the same three drugs as in panel B. (D) Example dose-response curves for pSQ-sites on BRCA1 and SETX that were uniquely regulated by dactolisib. (E) Schematic representation of cross-talk between the MAPK and AKT pathways and dose-dependent phosphorylation changes by selumetinib and MK-2206 alone or in combination (concentration ratio of 3:1).

