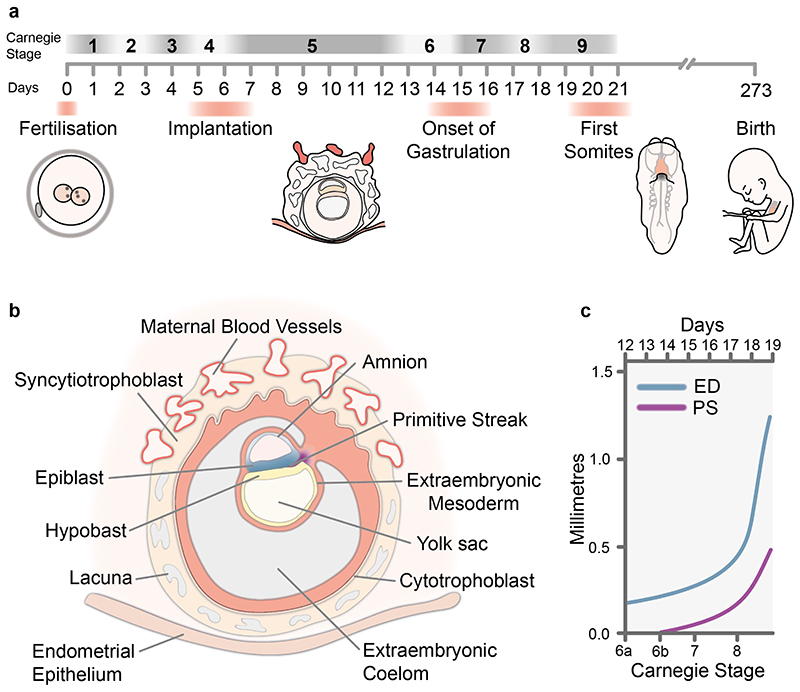
Figure 1. Staging Human Gastrulation.
a, Timescale of early human development highlighting Carnegie stages and key events during this period. b, Schematic diagram showing a human embryo at around Carnegie Stage 6b at the onset of gastrulation. c, Graph showing the onset of primitive streak formation and progression in size during Carnegie stages 6 to 8. Adapted from O’Rahilly 1973 Figure 235. ED, Embryonic Disk; PS, Primitive Streak.

