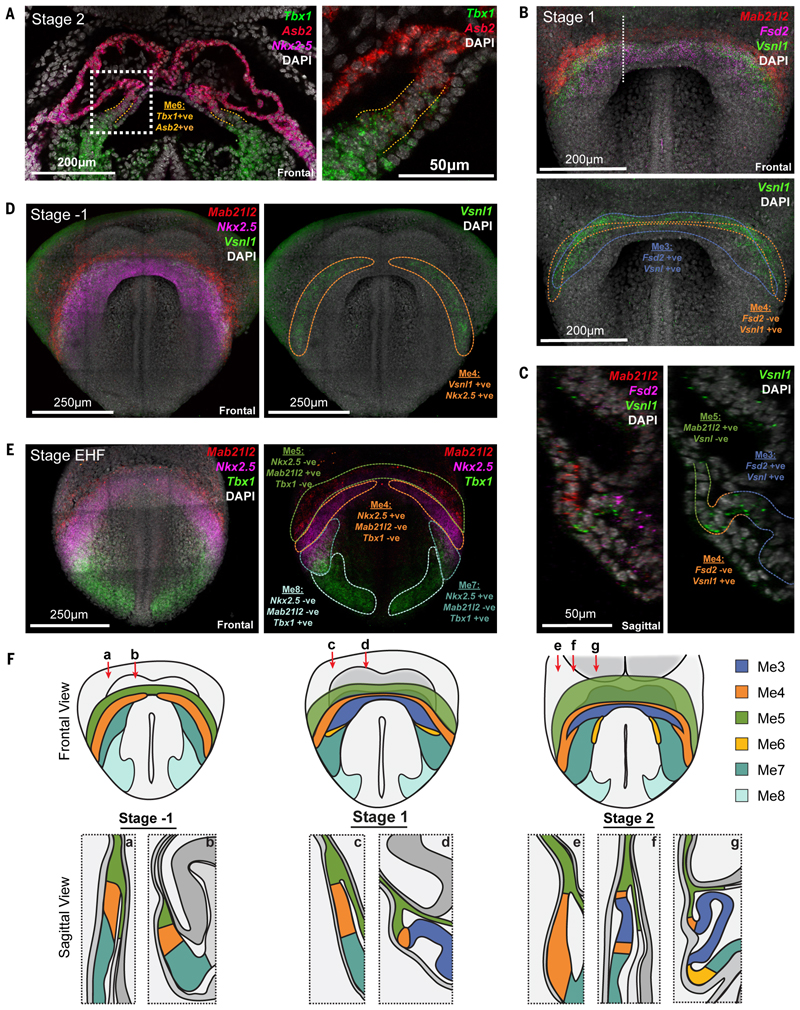
Fig. 4. Anatomical identification of transition states during cardiomyocyte differentiation.
A, Coronal section of a hybridization chain reaction (HCR) stained stage 2 embryo, showing the anatomical location of Me6 (dotted orange lines) marked by co-expression of Tbx1 and Asb2. Dotted white box represents region of higher magnification at right. B, Maximum intensity projection (MIP) of HCR on stage 1 embryo showing expression of Mab21l2, Vsnl1 and Fsd2 to identify cluster Me4. Colored dotted lines correspond to Me3 and Me4 (Movie S8). White dotted line shows location of section in C. C, Sagittal section of embryo in B highlighting locations of Me3, Me4 and Me5. D, MIP of HCR on stage -1 embryo showing Mab21l2, Vsnl1 and Nkx2-5, to identify cluster Me4 (yellow dotted line) (Movie S11). E, MIP of an early headfold (EHF) stage embryo, prior to crescent formation, showing expression of Mab21l2, Tbx1 and Nkx2-5, to identify clusters Me4, Me5, Me7 and Me8. Colored dotted lines outline corresponding regions. F, Schematic highlighting the anatomical location of all mesoderm transcriptional states identified at multiple stages of heart formation. Red arrows represent the location of sagittal sectional views.

