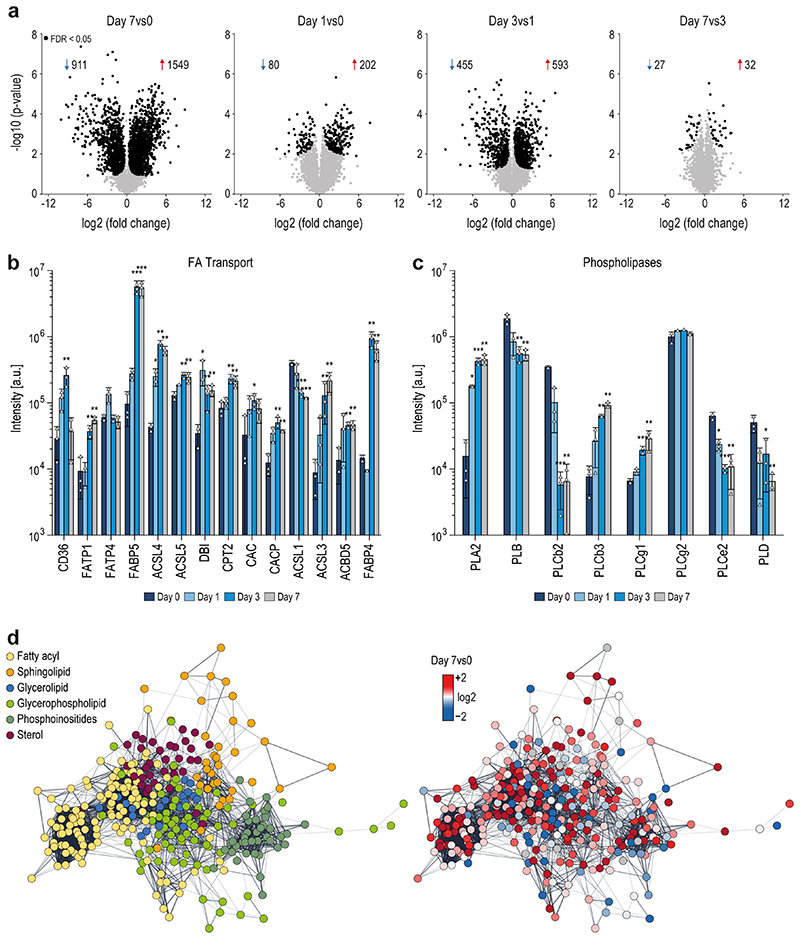
Extended Data Fig. 1. Protein regulation highlighting key proteins involved in lipid metabolism. Related to Figure 1.
a, Volcano plots of -log10 p-values over log2 fold changes of all identified proteins on day 0, 1, 3 and 7 of MK maturation. P-values were corrected using the Benjamini-Hochberg correction with an FDR cut-off of 0.05. b,c, Proteins of fatty acid transport pathways (b) as well as identified phospholipases (c) are depicted. A two-sided t-test was used for statistical analysis. Benjamini-Hochberg correction was applied to p-values using an FDR cut-off < 0.05 (*P ≤ 0.05, **P ≤ 0.01, ***P ≤ 0.001). d, Network highlighting proteins involved in lipid metabolism. Edges are correlations of r ≥ 0.85. Nodes represent proteins and the node color the associated lipid category (left). The network on the right is color-coded based on the log2 fold change of proteins regulated from day 0 to day 7. Pure red indicates an FC ≥ 2 and pure blue an FC ≤ -2. Data are combined from 3 independent biological experiments and mean values are shown. Error bars represent standard deviations.

