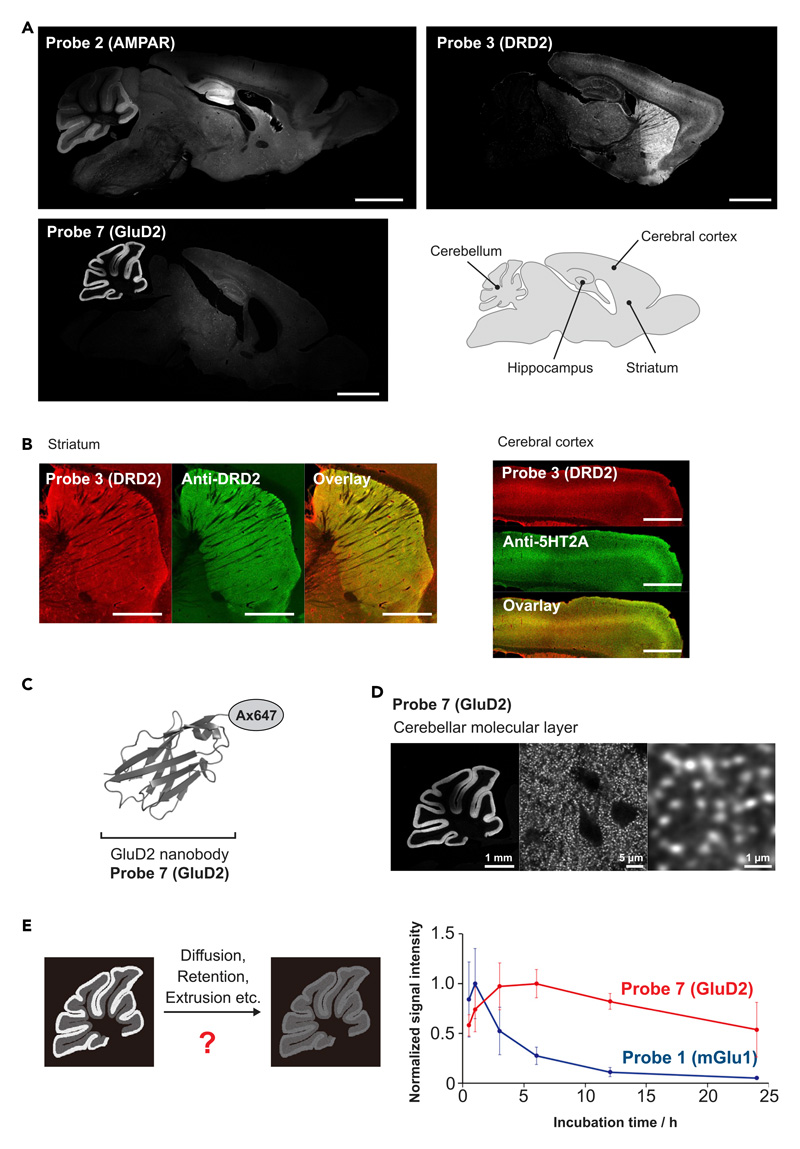
Figure 5. Distribution and localization analysis of FixEL probes 2 (AMPAR), 3 (RDR2), and 7 (GluD2) in the whole brain.
(A) Fluorescence imaging of whole-brain sagittal slices after FixEL. PBS(–) containing a probe (4.5 μL) was injected into the mouse lateral ventricle. Conditions: 40-μM probe 2 (AMPAR) (Cbrain is ca. 0.4 μM), incubation time 3 h. 25-μM probe 3 (DRD2) (Cbrain is ca. 0.25 μM), incubation time 16 h. 40 μM probe 7 (GluD2) (Cbrain is ca. 0.4 μM), incubation time 24 h. Fluorescence imaging of slices (50-μm thick) was performed using a CLSM equipped with a 10× or 5× objective and a GaAsP detector (633 nm excitation for Ax647). Scale bars, 2 mm.
(B) Co-immunostaining of the slices after FixEL with probe 3 (DRD2). The slices were fixed, permeabilized, and immunostained using anti-DRD2 or anti-5HT2A (green, Ax488-conjugated secondary antibody). Scale bars, 1 mm.
(C) An Ax647-conjugated GluD2 nanobody, probe 7 (GluD2). The model illustration of nanobody was from PDB 4zg1.
(D) Higher magnification image of the sample in (A) stained with probe 7 (GluD2). Fluorescence imaging was performed using a CLSM equipped with a 10× objective (left panel) and a 100× objective with lightning deconvolution (middle and right panel).
(E) Comparison of the time-dependent decrease in fluorescence of cerebellar regions between slice samples with FixEL using probe 1 (mGlu1) (blue circle) and probe 7 (GluD2) (red circle). The average values of the signal intensities of the four ROIs on the cerebellar molecular were normalized to their maximum value. Data are presented as mean ± SEM.
See also Figures S4 and S7.

