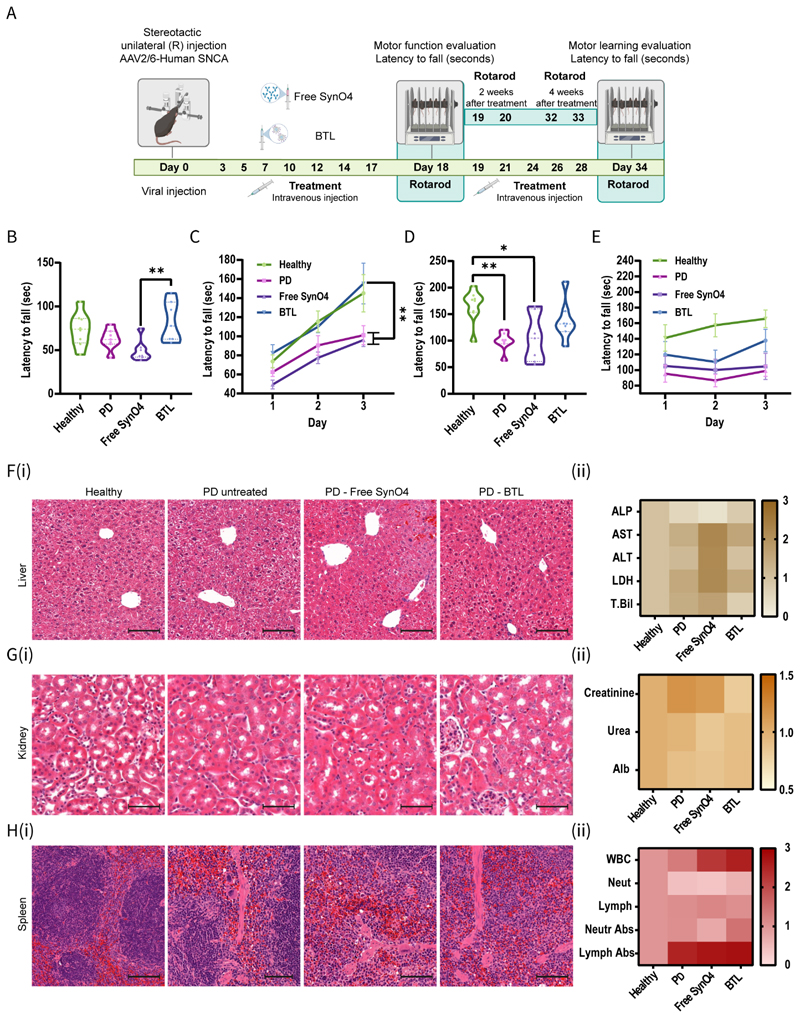
The capacity of BTL to prevent disease progression in a viral PD mice model.
(A). Schematic diagram illustrating the behavioral therapeutic efficacy experiment: Healthy mice received a unilateral AAV injection encoding human AS. Then, the mice were injected every other day with either free SynO4 or BTL for 2 or 4 weeks. At the end of the treatment period, mice were measured on three consecutive days in an accelerating speed rotarod to detect coordination and balance functions. (B). Motor functioning capacity on the first day of rotarod evaluation after treatment for two weeks. (C). Short-term motor learning capability after treatment for two weeks. (D). Motor functioning capacity on the last day (day 3) of rotarod evaluation after treatment for four weeks. (E). Long-term motor learning after treatment for four weeks. Histological organ sections (F(i)) liver, (G(i)) kidney, and (H(i)) spleen on day 40 of the experiment. Sections were stained with hematoxylin and eosin to identify the cell structure. No differences in cell structure can be observed between healthy and BTL-treated groups in all the evaluated organs (scale bar: 100 µm). (F(ii)). Hepatotoxicity test of blood on day 40 of the experiment. Hepatic enzymes, including alkaline phosphatase (ALP), aspartate transaminase (AST), alanine transaminase (ALT), lactate dehydrogenase (LDH), and total bilirubin (T.Bill), were measured. No differences can be observed between the healthy and BTL-treated groups. The presence of free Syno4 results in increased levels of hepatic enzymes and bilirubin, indicating liver damage. (G(ii)). Assessment of nephrotoxicity using blood collected on day 40 of the experiment. Creatinine, urea, and albumin levels were measured. No differences can be observed between the healthy and BTL-treated groups. (H(ii)). Assessment of white blood cell count (WBC) using blood sample collected on day 40 of the experiment. No differences can be observed between the healthy and BTL-treated groups. All values are normalized to the values of the healthy group. Neut- Neutrophils, Lymph- Lymphocytes. The results of B and D (7–8 independent repetitions) are presented as mean±standard deviation (SD). One-way ANOVA was used for statistical analysis; *p≤0.0109 **p≤0.0049. Results of C and E (7–8 independent repetitions) are presented as mean±SD. Two-way ANOVA was used for statistical analysis; *p≤0.0106 **p≤0.0075. The results of F(i), G(i) and H(i) are representative sections of three independent repetitions performed in 1–3 technical replicates. The results of F(ii), G(ii) and H(ii) (three independent repetitions performed in 5 technical replicates) are presented in heat maps. AAV, adeno-associated virus; AS, alpha-synuclein; BTL, brain-targeted liposomes; PD, Parkinson’s disease.

