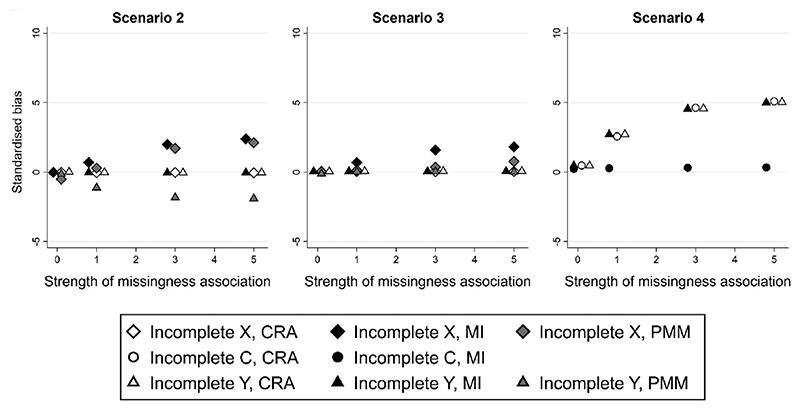
Fig. 2.
Standardized bias of complete records analysis (CRA), multiple imputation (MI), and predictive mean matching (PMM) estimates of parameter βX, plotted against the strength of the missingness association, given (i) Scenario 2: quadratic relationship between continuous variables Y and C, (ii) Scenario 3: quadratic relationship between continuous variables X and C, and (iii) Scenario 4: quadratic relationship between binary Y and continuous X, and either X, C, or Y partially observed. Some overlapping points have been horizontally jittered. Monte Carlo SE of bias is at most 0.006.

