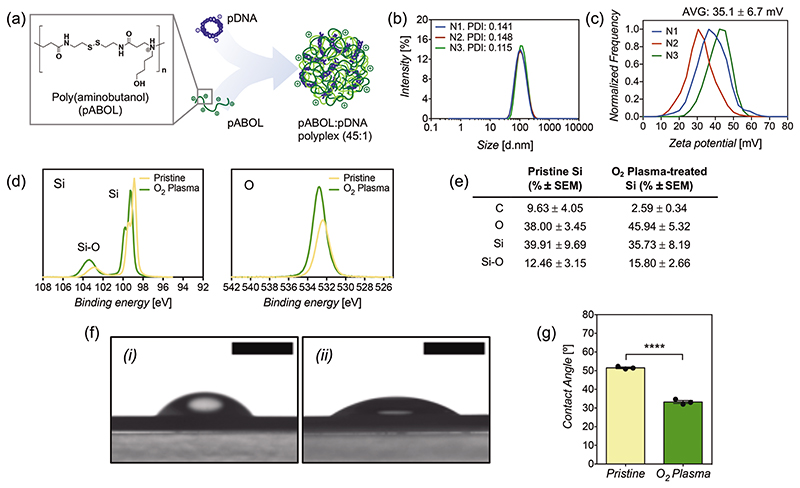
Figure 1.
a) Schematics of polyplex formation between pDNA and pABOL in a mass ratio of 1:45. b) Particle diameter of polyplexes via dynamic light scattering (DLS) and c) zeta potential of polyplexes. Three samples shown (N = 3) correspond to the mean of three measurements. d) Silicon and oxygen spectra using X-ray photoelectron spectroscopy (XPS) on the surface of pristine silicon nanoneedles and O2 plasma-treated silicon nanoneedles. e) XPS surface composition of pristine silicon and O2 plasma-treated silicon nanoneedles. Results are the mean of three samples (N = 3) ± SEM. f) Representative images of contact angle measurements on i) pristine silicon nanoneedles and ii) O2 plasma-treated silicon nanoneedles. Scale bars represent 2 mm. g) Contact angle values as the mean of three replicates (N = 3) ± SEM. Statistical significance difference as (****) p < 0.0001, using a two-tailed t-test.

