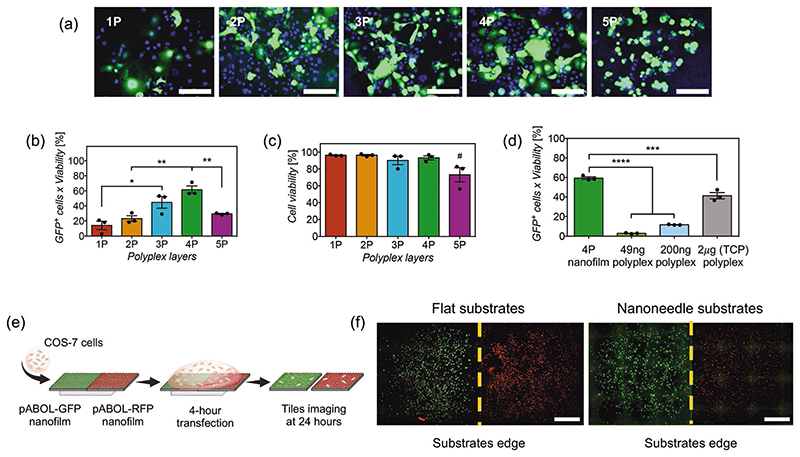
Figure 4.
a) Fluorescent microscopy images of COS-7 cells transfected and expressing pCAG-GFP plasmid (green) using silicon substrates coated with nanofilms containing 1 to 5 polyplex layers (1P to 5P). DAPI (blue) was used as a nuclear counterstain. Scale bars represent 100 μm. b) Quantification of transfection efficiency and c) viability via flow cytometry analyses of COS-7 cells transfected via silicon substrates coated with nanofilms containing 1 to 5 polyplex layers (1P to 5P) after 24 h incubation. Bars represent the mean ± SEM (N = 3). Statistical significance as (*) p < 0.05 and (**) p <0.01, using one-way ANOVA and Sidak’s test. (#) statistical significance with p < 0.05, using one-way ANOVA with Sidak’s test to compare 5P to all other groups. (ns) non-significant difference. d) Transfection efficiency of COS-7 cells seeded on silicon substrates coated with 4-polyplex layers versus polyplexes in suspension containing 49 and 200 ng of pDNA on top of silicon substrates; and a standard culture transfection of polyplexes using 2 μg of pCAG-GFP in TCP. Bars represent the mean ± SEM (N = 3). Statistical significance as (****) p < 0.0001, using one-way ANOVA and Sidak’s test. e) Schematics of the procedure to assess surface-mediated transfection using two contiguous silicon substrates on COS-7 cells, one containing pCAG-GFP (green, left) and the other pCAG-RFP (red, right). f) Tiled and stitched fluorescent microscopy images from the whole surface of two contiguous flat and nanoneedle substrates, expressing GFP (green) or RFP (red). Scale bars represent 2 mm.

