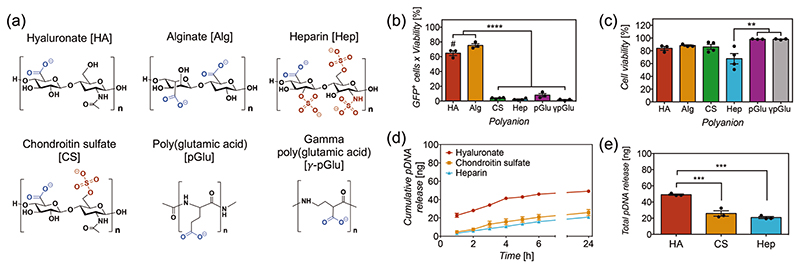
Figure 6.
a) Chemical structures of the polyanions assessed in the study, with their anionic groups highlighted in a different color. b) Transfection efficiency and c) viability of COS-7 cells transfected using nanoneedles with polyplex nanofilms containing distinct polyanions. Bars represent the mean ± SEM (N = 3–4). Statistical significance as (**) p < 0.01 and (****) p < 0.0001, using one-way ANOVA and Sidak’s test. (#) p < 0.05 compared to alginate. d) Cumulative release of pCAG-GFP plasmid DNA (nanograms) versus time (hours) and e) total amount of pCAG-GFP released at 24 h, from silicon substrates coated with 4-polyplex nanofilms containing hyaluronate (HA), chondroitin sulfate (CS) and heparin (Hep); in PBS buffer pH 7.4 containing 10 mM of reduced glutathione at 37 °C. Points and bars represent the mean of three replicates (N = 3) ± SEM. Statistical significance as (***) p < 0.001, using one-way ANOVA and Sidak’s test.

