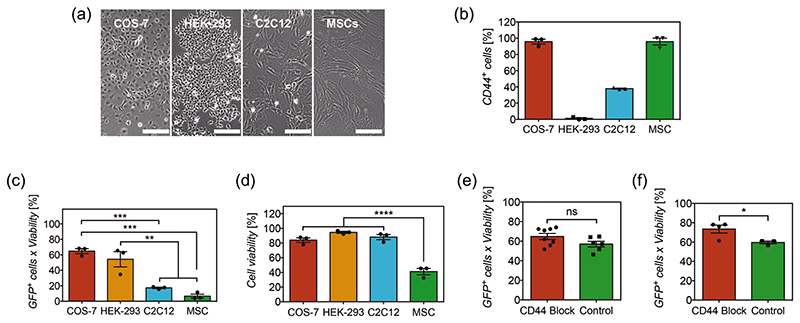
Figure 7.
a) Images of cell types studied and b) their level of CD44 expression receptor. Scale bars represent 200 μm. Bars represent the mean ± SEM (N = 3). c) Transfection efficiency and d) viability of distinct cell types transfected with nanoneedles coated with 4-polyplex nanofilms. Bars represent the mean ± SEM (N = 3). Statistical significance as (**) p < 0.01, (***) p < 0.001 and (****) p < 0.0001, using one-way ANOVA and Sidak’s test. e) Transfection efficiency of COS-7 cells before and after blocking of receptor CD44, using hyaluronate-chitosan-polyplex coated nanoneedles and f) alginate-chitosan-polyplex coated nanoneedles. Bars represent the mean ± SEM (N = 3–8). Statistical significance as (*) p < 0.05, using a two-tailed t-test. (ns) non-statistical difference.

