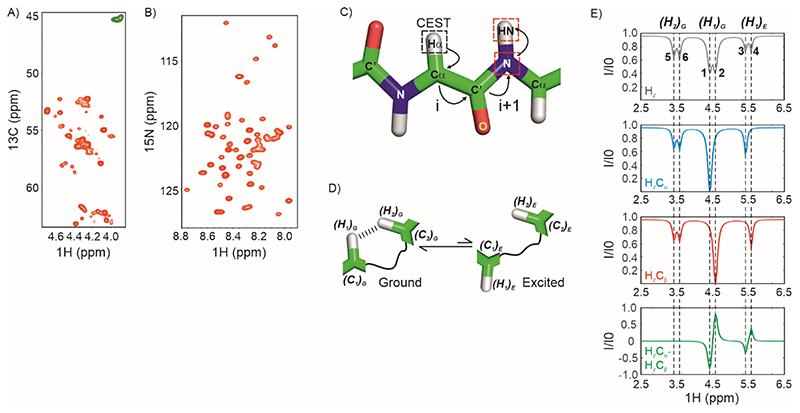
Figure 1. Strategy for acquiring 1Hα CEST data on IDPs.
A) The 1Hα region of a constant-time 1H-13C HSQC spectrum of U-13C,15N labelled CytRN. Green resonances arise from Gly which do not have a scalar coupled sidechain 13Cβ. B) 1H-15N HSQC spectrum of CytRN. C) The coherence transfer pathway in the 1Hα CEST experiment reported here. CEST is carried out on 1Hα (black dashed square) and the magnetization is then transferred from 1Hα(i) through 13Cα(i) and 13CO(i) to 15N (i+1) and then to 1HN(i+1) for detection. Red dashed squares indicate nuclei that are frequency labelled in the experiment. D) Cartoon representation of conformational exchange between ground and excited states of a protein where the alpha proton H1 comes close (< 5 Å) to H2 in the ground state. E) The spin-state-selective approach for acquiring proton CEST without interference from dipolar cross-relaxation. (Top) 1H CEST profile of an alpha proton resonating at 4.5 ppm (major dip), exchanging with a second conformation where the chemical shift of the 1Hα is 5.5 ppm (minor dip). The 1Hα is proximal to a second 1Hα which results in an NOE dip at 3.5 ppm. There is no 13C-decoupling during the CEST period; therefore doublets separated by 1JHαCα are seen for each dip. (Middle) Spin-state-selective CEST data selecting for HzCα (blue) and HzCβ (red). (Bottom) CEST profile of HzCα-HzCβ =2HzCz, where the NOE dip cancels out (green).

