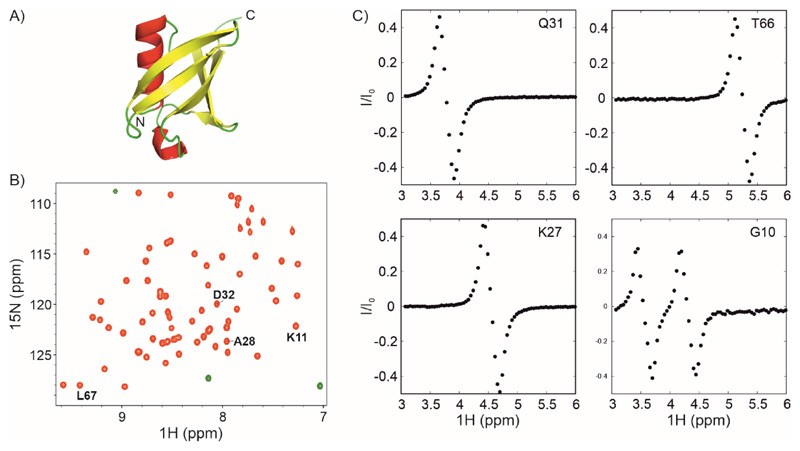
Figure 3. 1Hα CEST on U-13C,15N labelled ubiquitin.
A) Three-dimensional structure of ubiquitin showing helices, sheets and loops in red, yellow and green respectively (PDB ID: 1UBQ (99)). B) 1H-15N HSQC spectrum of ubiquitin. C) 1Hα CEST profiles of selected residues in ubiquitin that were obtained by analyzing the i+1 correlations indicated in the HSQC spectrum in panel B. 1Hα CEST data were acquired using the pulse sequence in Figure 2. The 1Hα CEST profile for Gly10 shows two dips arising from each of the two diastereotopic 1Hα protons of Gly10.

