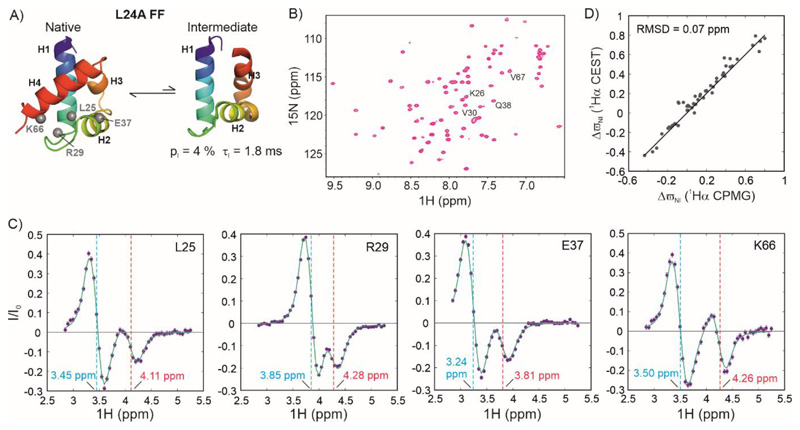
Figure 4. Characterizing exchange in the folded L24A FF domain using 1Hα CEST.
A) Cartoon representation of the native (31) and intermediate states of L24A FF (PDB ID:2L9V (31)) in exchange on the millisecond timescale. B) 1H-15N HSQC spectrum of L24A FF. Resonances whose 1Hα CEST profiles are quantified in panel C are labelled in the spectrum. C) 1Hα CEST profiles of selected resonances of L24A FF. Cyan and red dashed lines indicate the chemical shifts of the native and intermediate states respectively. D) Correlation between the 1Hα chemical shifts of L24A FF intermediate states acquired using 1Hα CPMG (y-axis, (31)) and 1Hα CEST (x-axis). The solid line depicts the y=x function.

