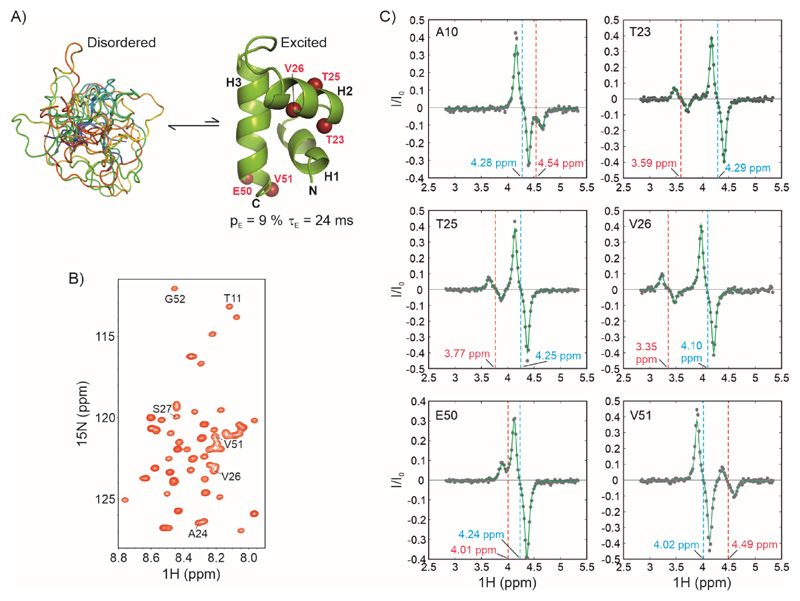
Figure 5. Characterizing exchange in the IDP CytRN using 1Hα CEST.
A) CytRN exchanges between a disordered ensemble and a three-helix bundle folded state (52). B) 1H-15N HSQC spectrum of disordered CytRN showing limited spectral dispersion characteristic of an IDP. Resonances for which 1Hα CEST profiles are quantified in panel C are labelled on the spectrum (except A10, which is not a part of the fragment included in the structure calculation). C) 1Hα CEST profiles of selected residues of CytRN. The chemical shift positions of the ground (disordered) and excited (folded) states are indicated by cyan and red dashed lines respectively.

