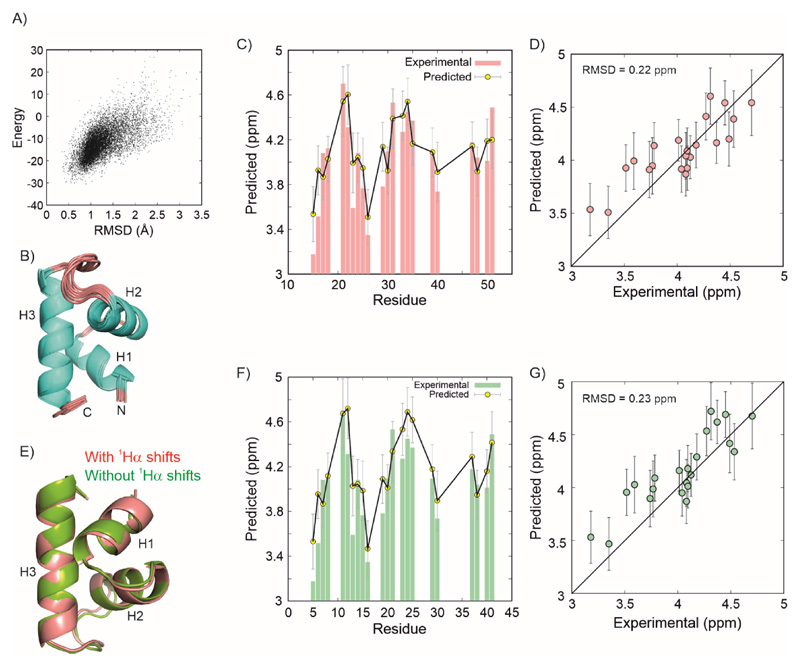
Figure 6. Structure of the CytRN excited state calculated chemical shifts and RDCs.
A) Composite chemical shift and Rosetta energy score of structures plotted against the RMSD of each structure to the lowest energy structure. B) Overlay of the cartoon representations of the 10 structures with the lowest energy. Comparison between the experimental (red bars) and predicted 1Hα chemical shifts (yellow circles) for the CytRN excited state shown as a function of residues (C) and as a correlation plot (D). Predictions were done using Sparta+ on the lowest energy structure. Error bars are uncertainties in residue-specific chemical shift predictions from Sparta+. E) Overlay of the CytRN excited state calculated without (green) and with (red) 1Hα chemical shifts. F,G) A comparison of the same experimental data as in panels (C) and (D) with predictions made using Sparta+ (84) on the lowest energy structure calculated without using input 1Hα chemical shifts (52).

