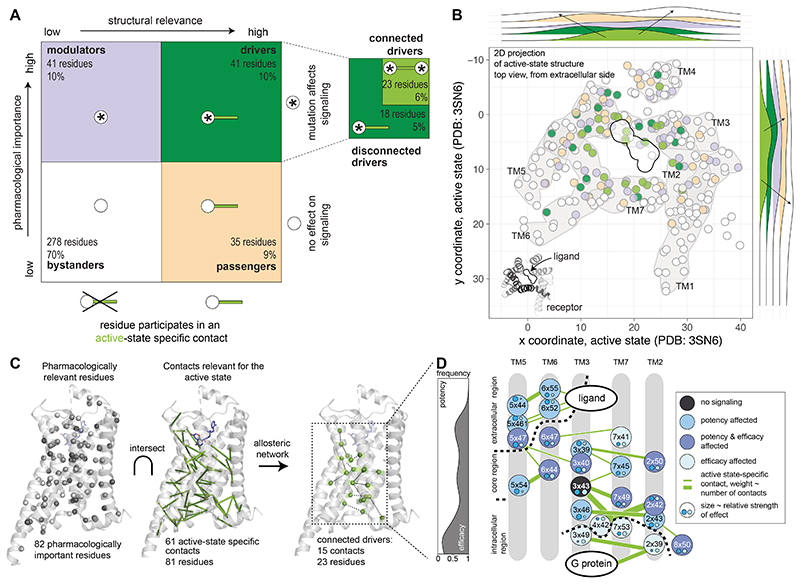
Fig. 5. The allosteric contact network for efficacy and potency as determined by structure and pharmacology.
(A) Classification of residues according to their pharmacological importance (whether a mutation affected signaling or not) and structural relevance (whether a residue forms an active-state specific contact or not) into four main classes: bystanders (white), passengers (wheat), modulators (slate) and drivers (green), the latter is subdivided into connected drivers (driver residues connected to other driver residues) and unconnected driver residues (Methods). (B) Position of residues classified by their participation in active state-specific contacts and importance for pharmacology on a 2D top view projection of the active, G protein-bound structure of the β2AR (PDB 3SN6). Frequency of residues along the x- and y-axis of the receptor (plane parallel to the membrane) is shown on the distributions outside. Arrows denote the direction of the peaks of the distribution for the residue classes. Driver residues tend to be in the centre, whereas bystander residues tend to be at the periphery. (C) Integration of pharmacologically important residues and the residues contributing to newly established contacts in the active-state structure yields the allosteric network for efficacy and potency (see Main text). (D) Residues forming the allosteric networks for efficacy and potency are represented as a cartoon, colored by the effect of the mutation. The graph (left panel) depicts the frequency of potency versus efficacy effects for residues in the network, projected on the axis running along the extra- to intra-cellular side. Small circles and their size (scaled to the relative strength of effect) within each residue indicate the magnitude and effect on potency and efficacy. Edge thickness in the network corresponds to the number of contacts, ranging from 1-5.

