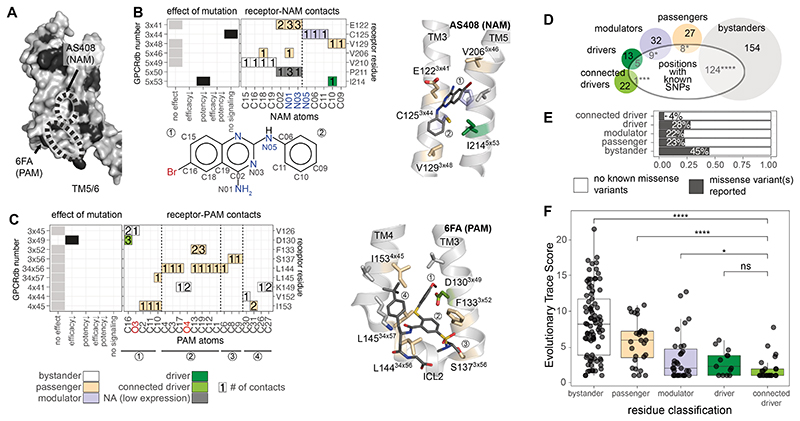
Fig. 6. Allosteric sites, evolutionary conservation, and natural variation.
(A) Surface-exposed pharmacologically important residues are shown in black on the β2AR (PDB ID: 3SN6). (B) Effect of mutations in the binding site for AS408, a negative allosteric modulator, receptor residue – ligand (NAM) atom contact plot, and structural view. The contact plot shows the number of contacts between receptor residues (y-axis) and NAM atoms (x-axis). Colors for the receptor-NAM contacts in the plot refer to the classification of the residues as in Fig. 5. The chemical formula of the allosteric modulator below the heatmap indicates the labeling of NAM atoms used for the x-axis of the contact plot. (C) Effect of mutations in the binding site for 6FA, a positive allosteric modulator, receptor residue – ligand (PAM) atom contact plot, and structural view. The contact plot shows the number of contacts between receptor residues (y-axis) and PAM atoms (x-axis). Colors for the receptor-PAM contacts in the plot refer to the classification of the residues as in Fig. 5. The circled numbers below the x-axis refer to different parts of the modulator and are mapped on the structure view for reference. (D) The number of residues with known single nucleotide polymorphisms (SNPs) for each class. (E) Percentage of residues for which at least one SNP has been reported by class. Significant differences from the expected frequency by chance are indicated according to a hypergeometric test (* p ≤ 0.05, ** p ≤ 0.01, *** p ≤ 0.001, **** p ≤ 0.0001, ns: non-significant). (F) Adrenergic receptor evolutionary trace (ET) score for the different residue classes. Groups were compared using a Wilcoxon test (* p ≤ 0.05, ** p ≤ 0.01, *** p ≤ 0.001, **** p ≤ 0.0001, ns: non-significant). Driver refers to the subset that is in the disconnected driver group.

