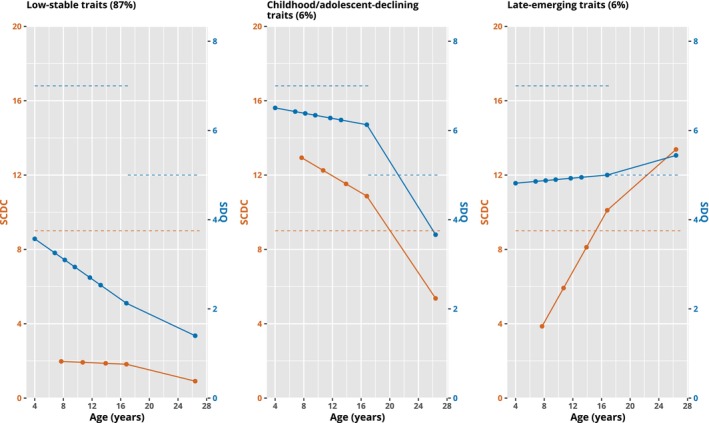
Figure 2.

Mean trajectories of 3‐class GMM model. The blue line shows SDQ‐ADHD subscale mean values and orange line shows SCDC mean values. Recommended SCDC and SDQ‐ADHD cut‐points are shown with dashed lines of the same colours. Note the change in threshold for SDQ‐ADHD between childhood and late‐adolescence/adulthood
