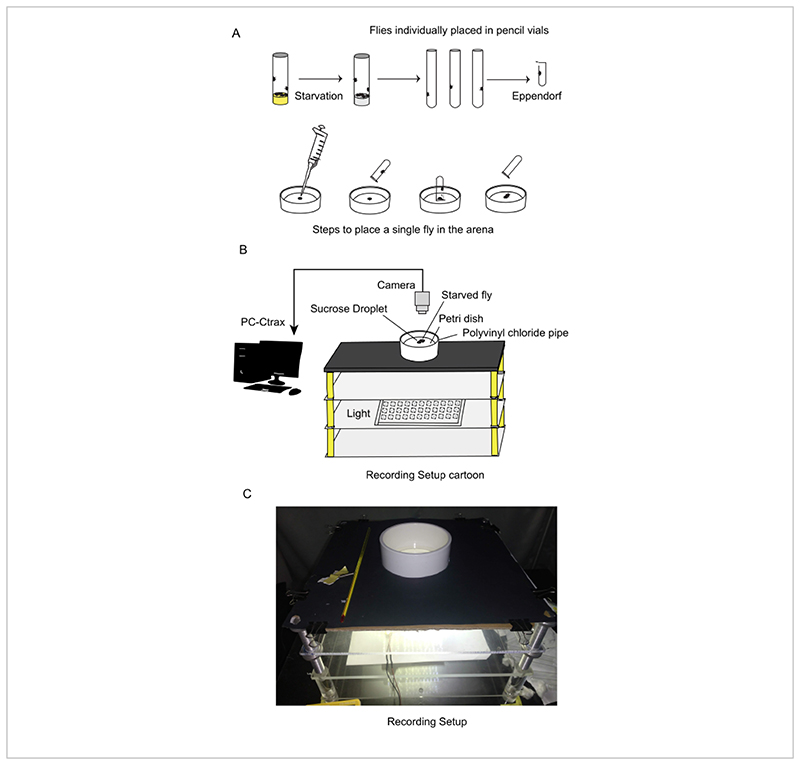
Figure 2. Experimental setup including starvation tolerance calculation, behavior recording procedures, and trajectory analysis.
(A) Food-starvation tolerance was determined to establish a standardized hunger state. For behavior recording, individual flies were isolated in small tubes before the experiment. The behavioral arena, a 90 mm Petri dish, was uniformly illuminated from the bottom. A drop of sugar solution was placed in the center and flies were given unrestricted access to the food source. (B) The behavior was recorded until flies escaped from the arena. Video analysis used Ctrax software for tracking and MATLAB/Python for trajectory analysis. (C) Photograph of the experimental setup.

