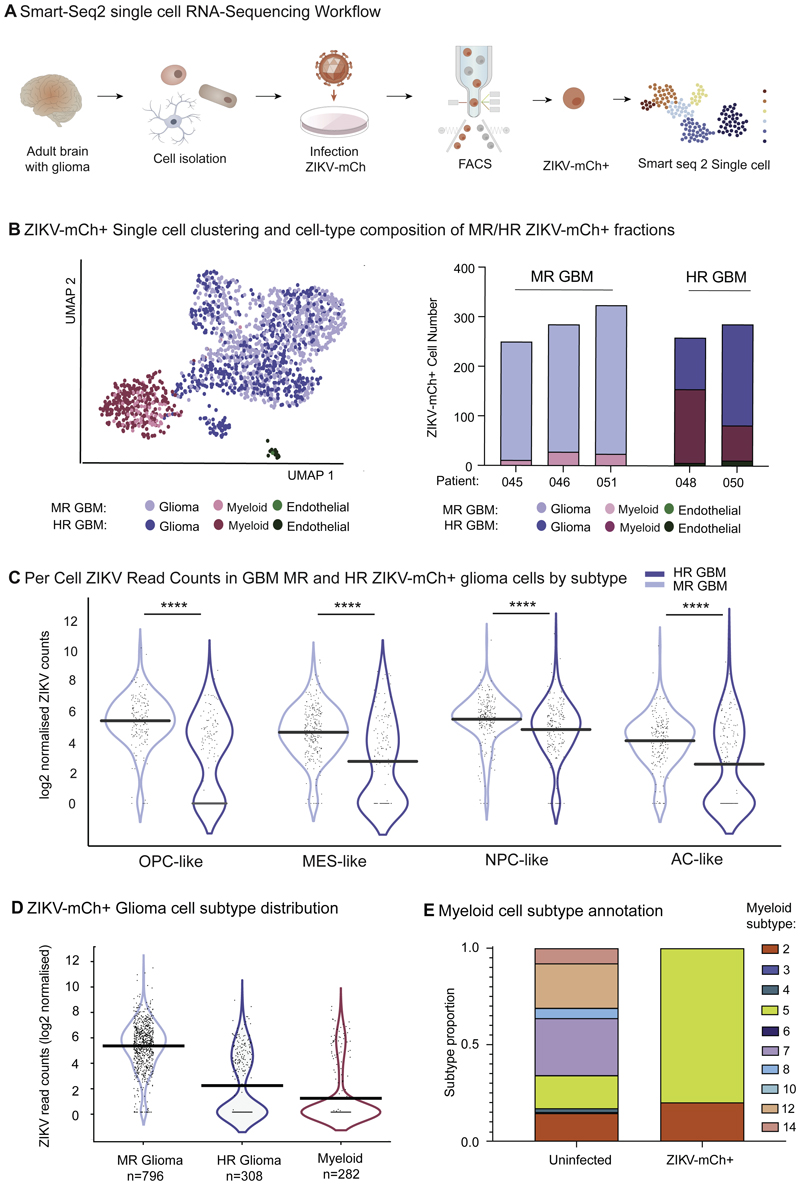
Figure 4. ZIKV productively infects diverse glioma stem cell identities. Infection is modulated by TME myeloid cells, and these adopt pro-inflammatory anti-viral states in response to ZIKV-mCh+ uptake.
(A) Plate-based Smart-Seq2 single cell analysis of FACS sorted ZIKV-mCh+ GBM cells demonstrates predominance of glioma cell and myeloid cell identities.
(B) Proportions of each cell type captured in 3 MR GBM and 2 HR GBM ZIKV-mCh+ single cell libraries.
(C) Per cell normalised ZIKV read counts by glioma cell subtype: oligodendrocyte precursor cell-like (OPC-like), mesenchymal-like (MES-like), neural precursor cell-like (NPC-like), astrocyte-like (AC-like) (Neftel et al., 2019) and by parent tumour ZIKV resistance for all ZIKV-mCh+ glioma cells captured (horizontal bar indicates mean normalised transcript count per cell). Wilcoxon rank test p< 0.00001 for all cell subtype GBM MR vs HR comparisons.
(D) Summary per cell normalised ZIKV read counts for ZIKV-mCh+ glioma cells in MR and HR GBM, and for myeloid cells from all tumours pooled (horizontal bar indicates mean normalised transcript count per cell; Wilcoxon signed rank test glioma cell (HR GBM) vs glioma cell (MR GBM) p = 8.3e-64).
(E) Myeloid cell transcriptional subtypes comprising uninfected parent tumour samples (profiled by 10x RNA-Seq) and ZIKV-mCh+ myeloid cells (Smart-Seq2). Clusters according to (Sankowski et al., 2019): clusters 2 and 5 correspond to pro-inflammatory anti-viral states.

