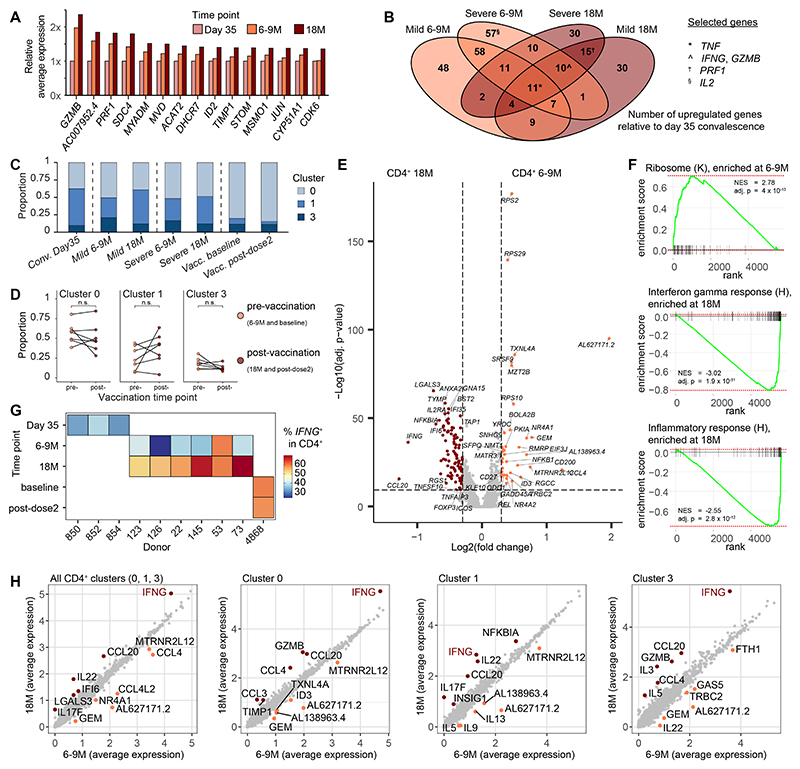
Fig. 4. SARS-CoV-2 spike-specific CD4+ T cells exhibit a proinflammatory profile in the setting of hybrid immunity.
(A) Ranked comparison of average transcription expression in AIM+ CD4+ T cells grouped by time point. (B) Venn diagram showing differentially expressed genes shared among groups compared with AIM+ CD4+ T cells from recently infected donors sampled on day 35. (C) Proportions of AIM+ CD4+ T cells belonging to each CD4+ T cell cluster. (D) Comparison of the proportion of cells belonging to each CD4+ T cell cluster from mild, severe, and recently vaccinated donors. (E) Volcano plot showing differentially expressed genes between AIM+ CD4+ T cells at 6–9M versus 18M. Dashed lines indicated adjusted p-value = 0.05 and fold change = ±0.25. (F) Gene set enrichment analysis of differentially expressed genes between AIM+ CD4+ T cells at 6–9M versus 18M showing significant hits from the KEGG (K) and Hallmark (H) pathways. NES: normalized enrichment score. (G) Percentages of AIM+ CD4+ T cells with expression of IFNG. (H) Comparison of average gene expression for all AIM+ CD4+ T cells versus individual CD4+ T cell clusters separated by time point. Labels identify the top six genes with the largest differences in expression. Statistical significance was determined by paired Wilcoxon Signed-Rank test (D), Mann–Whitney U test (E) and Broad GSEA test (F). Adjusted p-values calculated using the Bonferroni (E) and Benjamini–Hochberg (F) methods. n.s. = P > 0.05.

