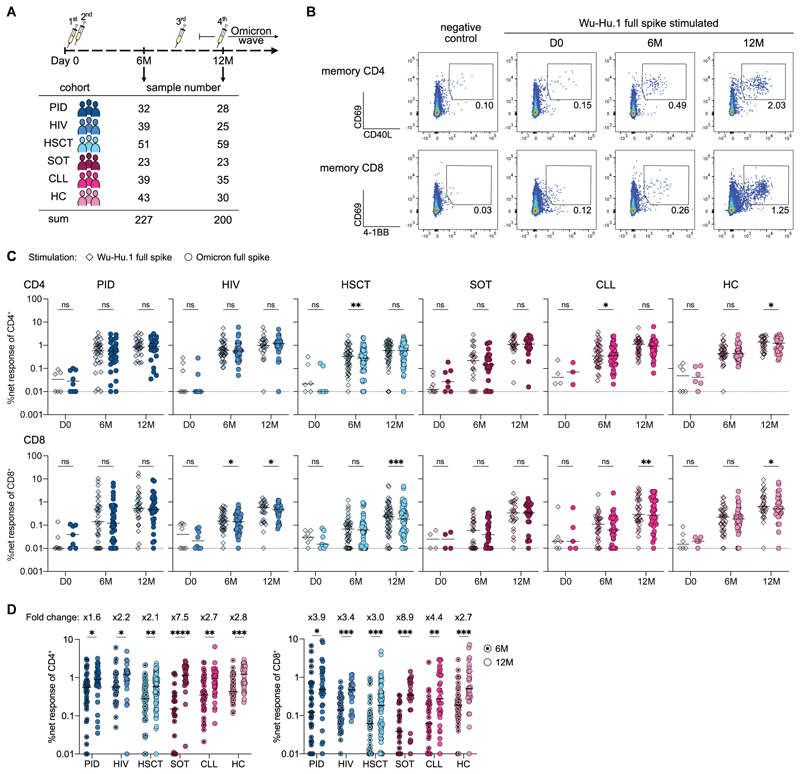
Fig. 1. Booster with ancestral mRNA vaccine generates robust Omicron-reactive T cell responses across various immunocompromised states.
(A) Schematic of the longitudinal study design involving six groups of healthy and immunocompromised patients. (B) Representative plots depicting upregulation of activation markers on memory CD4+ (CD69, CD40L) and memory CD8+ (CD69, 4-1BB) T cells upon stimulation with negative control or Wu-Hu.1 full spike peptide pool over time. (C) Net frequencies (background-subtracted using DMSO negative control) of T cell responses to Wu-Hu.1 full spike and Omicron full spike peptide pools over time across all patient groups. (D) Comparison of pre- and post-booster net frequencies of CD4 and CD8 Omicron-reactive T cell responses with indicated median fold changes. (A to D) PID, primary immunodeficiency; HIV, human immunodeficiency virus type 1; HSCT, hematopoietic stem-cell transplantation; SOT, solid organ transplantation; CLL, chronic lymphocytic leukemia; HC, healthy controls. (C, D) Each dot represents one donor and lines depict the median. (C) Wilcoxon matched-pairs signed rank test for Wu-Hu.1 versus Omicron comparison with Holm-Šidák posttest to correct for multiple comparisons. (D) Mann-Whitney test with Holm-Šidák posttest. ****p <0.0001, ***p <0.001, **p <0.01, *p <0.05.

