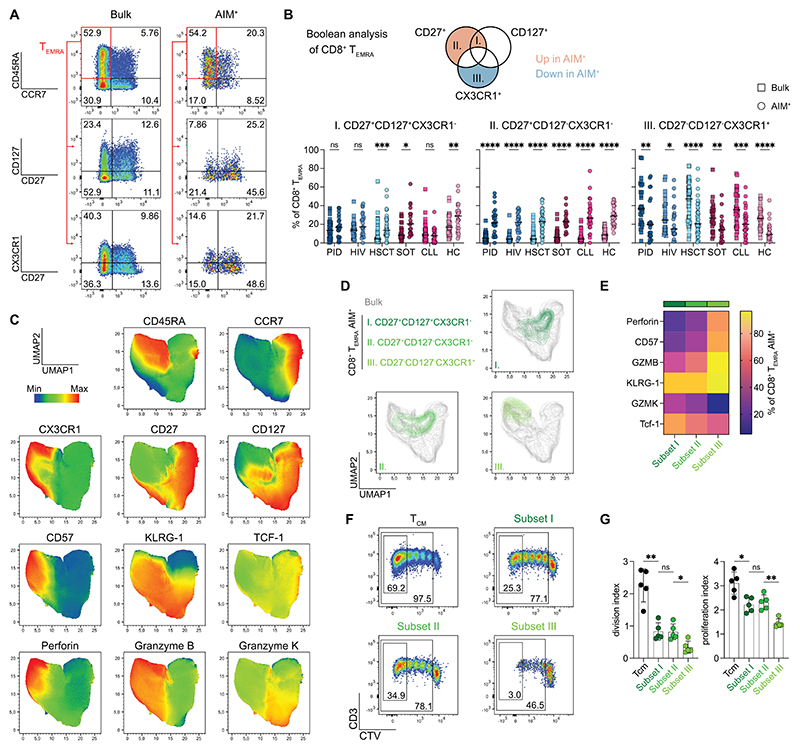
Fig. 4. TEMRA subpopulations with stem-like signatures are enriched in Omicron-reactive CD8+ T cells.
(A) Representative plots show gating on CD8+ TEMRA population as well as expression of CD27, CD127, and CX3CR1. (B) Boolean gating of CD8+ TEMRA cells based on CD27, CD127, and CX3CR1 expression. Quantification shows frequencies of three different TEMRA subpopulations between bulk and Omicron-reactive after booster doses. Each dot represents one donor, and lines depict the median. Wilcoxon matched-pairs signed rank test with Holm-Šidák posttest. (C) UMAP of bulk memory CD8+ T cells upon stimulation with Omicron full spike peptide pool (n=5 healthy donors, activation-markers excluded from UMAP calculation). (D) UMAP from (C) with an overlay of Omicron-reactive CD8+ TEMRA subsets. (E) Heatmap of key differentiation markers from data shown in (C, D) (n=11 healthy donors). (F) Representative plots showing Cell Trace Violet (CTV) dilution after five days of CD3/CD28 stimulation of sorted CD8+ TEMRA subsets and TCM as control. (G) Proliferative capacity shown as division and proliferation index calculated with data measured in (F). Each dot represents one donor, and lines depict the mean ± SD. Mann-Whitney test between indicated groups. (B, G) ****p <0.0001, ***p <0.001, **p <0.01, *p <0.05.

