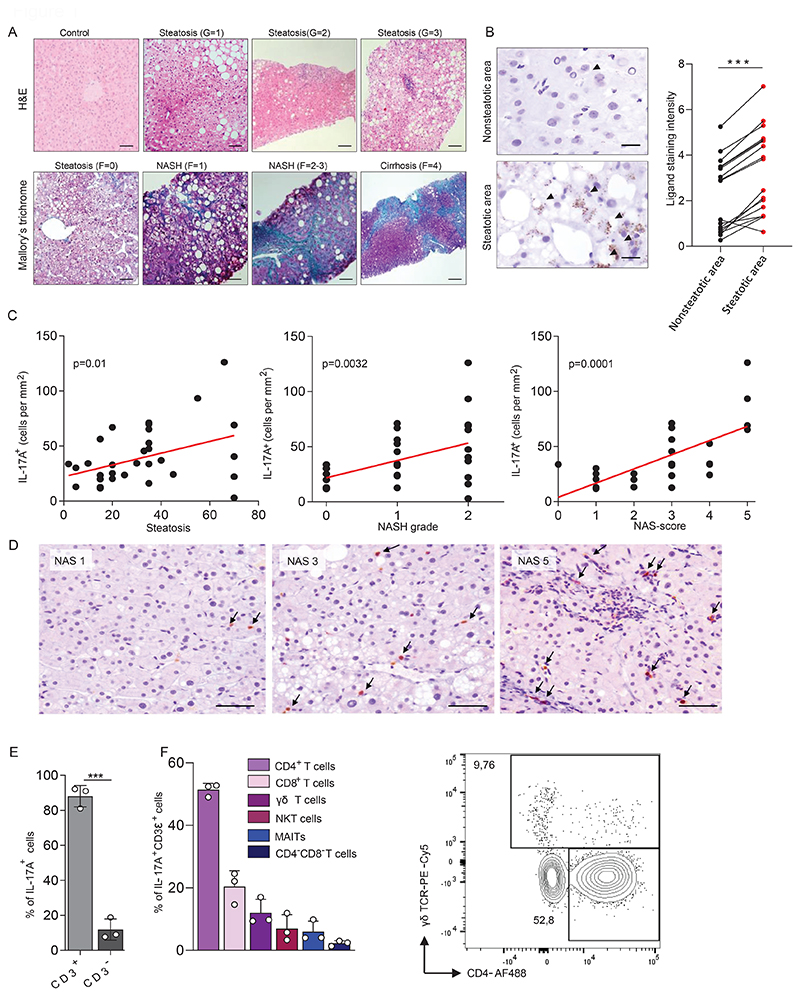
Figure 1. MALFD is associated with an increase of NKG2D ligands and IL-17A expressing cells in the liver.
(a) Representative histological slides of various stages of liver disease in human liver biopsies. (top) slides were stained with hematoxylin and eosin (H&E) and show a sample from a healthy individual and from MAFLD patients with mild (G=1), moderate (G=2), or severe (G=3) steatosis with ballooning and inflammation. (bottom) slides were stained with Mallory`s trichrome and show liver tissue without fibrosis (F=0) or with perisinusoidal and pericellular fibrosis without (F=1) or together with extensive portal fibrosis (F=2-3) or with cirrhosis (F=4). Scale bars indicate 50 µm for control, steatosis (G=1), steatosis (F=0), NASH (F=1); 100 µm for steatosis (G=2), steatosis (G=3), NASH (F=2-3); 250 µm for cirrhosis (F=4). (b) Human biopsy material of patients with MAFLD was stained for the NKG2D ligands MICA/B. Shown is NKG2D-L expression in steatotic and non-steatotic regions within the same patient (n=17). Scale bars indicate 20 µm. Arrowheads indicate a positive signal. (c-d) Human biopsy material of patients with MAFLD was stained for IL-17A. (c) The number of IL-17A-producing cells was correlated with the level of steatosis, grade of NASH, or the NAS-score (n=35). (d) Representative staining for NAS scores 1, 3 and 5. Scale bars indicate 50µm. (e-f) Quantification of IL-17A-producing cells in biopsies of human livers by flow cytometry. (e) Quantification of CD3+ and CD3- cells within the IL-17+ population (n=3). (f) Quantification of IL-17A-producing T cells within the CD3+IL-17A+ cell pool (n=3). Representative plot shows cells gated for IL-17A+CD3+TCRαV7.2-CD56-. Statistical significance was determined by Wilcoxon signed-rank test (b), linear regression (c), or unpaired t-test (e). Statistical significance was defined as *p<0.05; **p<0.01; ***p<0.001.

