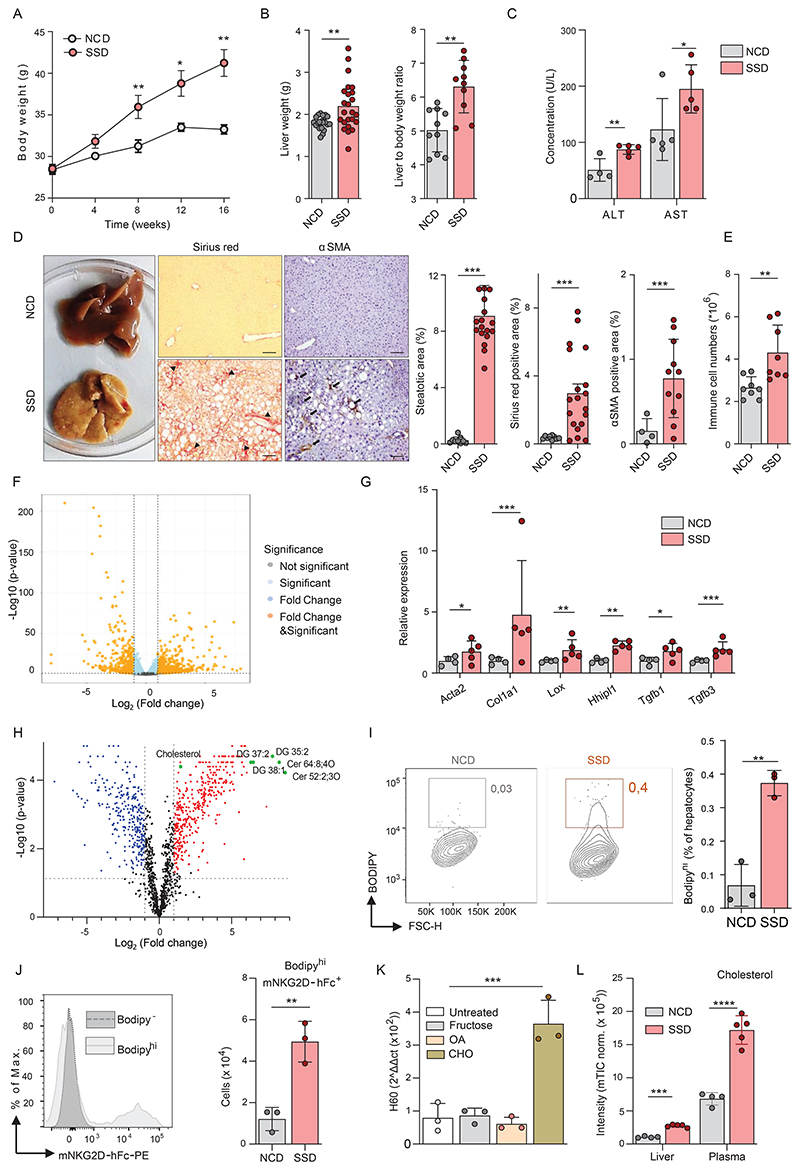
Figure 2. Lipid accumulation in murine hepatocytes induces upregulation of NKG2D ligands.
(a-e) WT mice were fed a Steatosis and Steatohepatitis Diet (SSD) or a Normal Chow Diet (NCD) for 2 to 16 weeks. (a) Total body weight over time (n=20). (b) Liver weight and the liver to body weight ratio at 16 weeks (n=22-24). (c) Serum AST and ALT levels after 16 weeks (n=5). (d) Representative liver slides (200x) of fibrosis and hepatic stellate cell activation (αSMA) after 16 weeks of SSD feeding. Macroscopic changes in livers of SSD diet-fed mice showing yellow/gray firm parenchyma indicative for liver steatosis and fibrosis. Arrowheads indicate collagen accumulation. Arrows indicate αSMA+ cells. Bar diagrams show the quantification of histology slides (n=4-19). Scale bars indicate 20 µm. (e) Quantification of immune cells (CD45+) in liver after 2 weeks determined by flow cytometry (n=8). (f-g) Total liver lysates were analyzed by RNA sequencing after 3 weeks of NCD or SSD feeding (n=4-5). (f) Volcano plot of differentially expressed genes. (g) Expression of key genes associated with liver fibrosis. (h) LC-MS/MS analysis of lipid species in the liver and plasma of mice fed for 18 days with NCD, or SSD. (i) BODIPY staining of hepatocytes isolated from liver 2 weeks after initiation of SSD feeding (n=3). (j) Quantification of NKG2D ligand-expressing cells within BODIPYBright hepatocytes after 2 weeks of NCD or SSD feeding (n=3). (k) Quantification of the NKG2D ligand H60 by qPCR (n=3) normalized to HPRT expression. (l) Levels of cholesterol in liver lysate and plasma samples of NCD or SSD fed mice determined by LC-MS/MS analysis. Shown are representative data of at least two experiments, or pooled data of two independent experiments (a,b,d). Shown are means +/- s.e.m. Statistical significance was determined by unpaired t-test (a-j, l) and ANOVA with Bonferoni post-testing (k). Statistical significance was defined as *p<0.05; **p<0.01; ***p<0.001.

