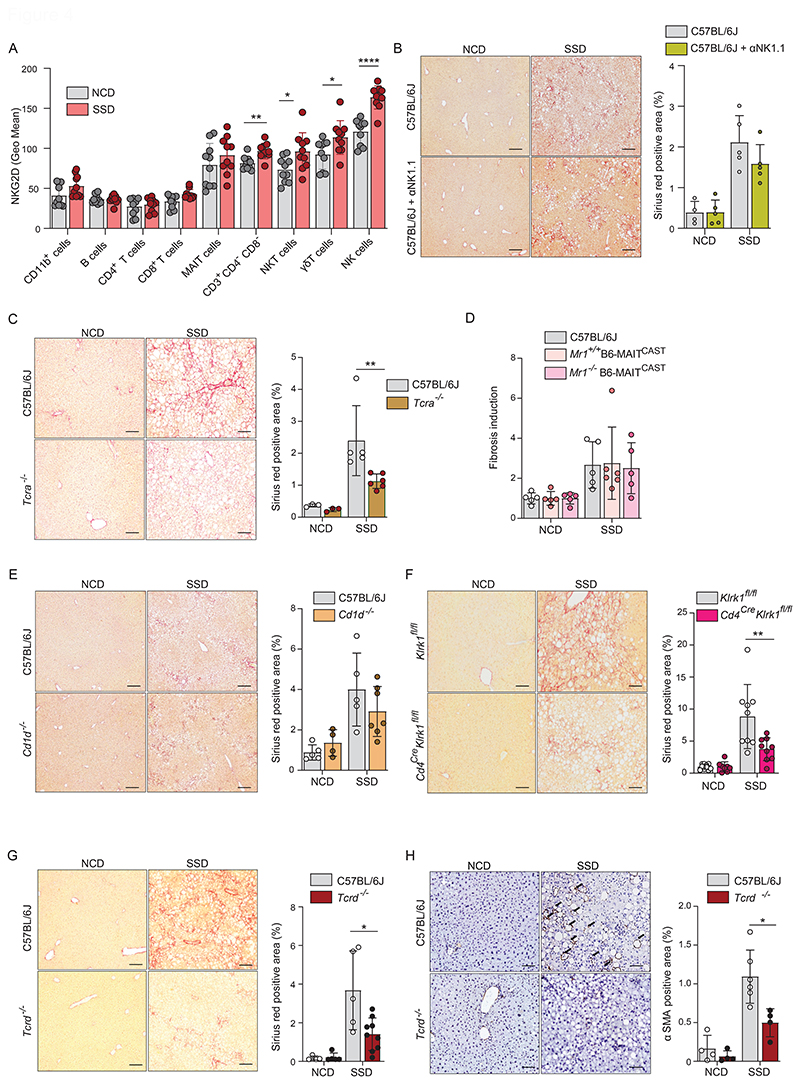
Figure 4. Liver fibrosis in the context of NASH is mediated by innate-like T cells.
(a) WT mice were fed with an NCD or SSD for 18 days and NKG2D expression was quantified in key hepatic leukocyte populations by flow cytometry (n=5). (b) WT mice and C57BL/6J mice treated with NK cell-depleting antibody on a weekly basis were fed an NCD or an SSD diet for 16 weeks. Shown are (left) representative liver slides stained with Sirius Red (200 X) and (right) quantification of fibrosis (n = 4-5) (c) WT and Tcra-/- (T cell receptor δ-chain deficient) mice were fed an NCD or an SSD diet for 16 weeks. Shown are (left) representative liver slides stained with Sirius Red (200 X) and (right) quantification of fibrosis (n = 5). (d) WT, Mr1+/+B6-MAITCAST and Mr1-/-B6-MAITCAST mice were fed an NCD or an SSD diet for 16 weeks. Quantification of fibrosis is shown (n = 5-6). (e) WT and Cd1d-/- mice were fed an NCD or an SSD diet for 16 weeks. Shown are (left) representative liver slides stained with Sirius Red (200 X) and (right) quantification of fibrosis (n = 4-7). (f) CD4CreKlrk1Flox/Flox and Klrk1Flox/Flox littermate controls were fed an NCD or an SSD diet for 16 weeks. Shown are (left) representative liver slides stained with Sirius Red (200 X) and (right) quantification of fibrosis (n = 9-10). (g, h) WT and Tcrd-/- (T cell receptor α-chain deficient) mice were fed an NCD or an SSD diet for 16 weeks (n=4-10). (g) Shown are (left) representative liver slides stained with Sirius Red (200 X) and (right) quantification of fibrosis. (h) Shown are (left) representative liver slides stained for αSMA and (right) quantification of hepatic stellate cell activation (200 X). Scale bars indicate 100 µm. The data are representative of at least two independent experiments or pooled data of at least two experiments (a, f). Shown are means +/-s.e.m. Statistical significance was determined by unpaired t test. Statistical significance was defined as *p<0.05; **p<0.01; ***p<0.001.

