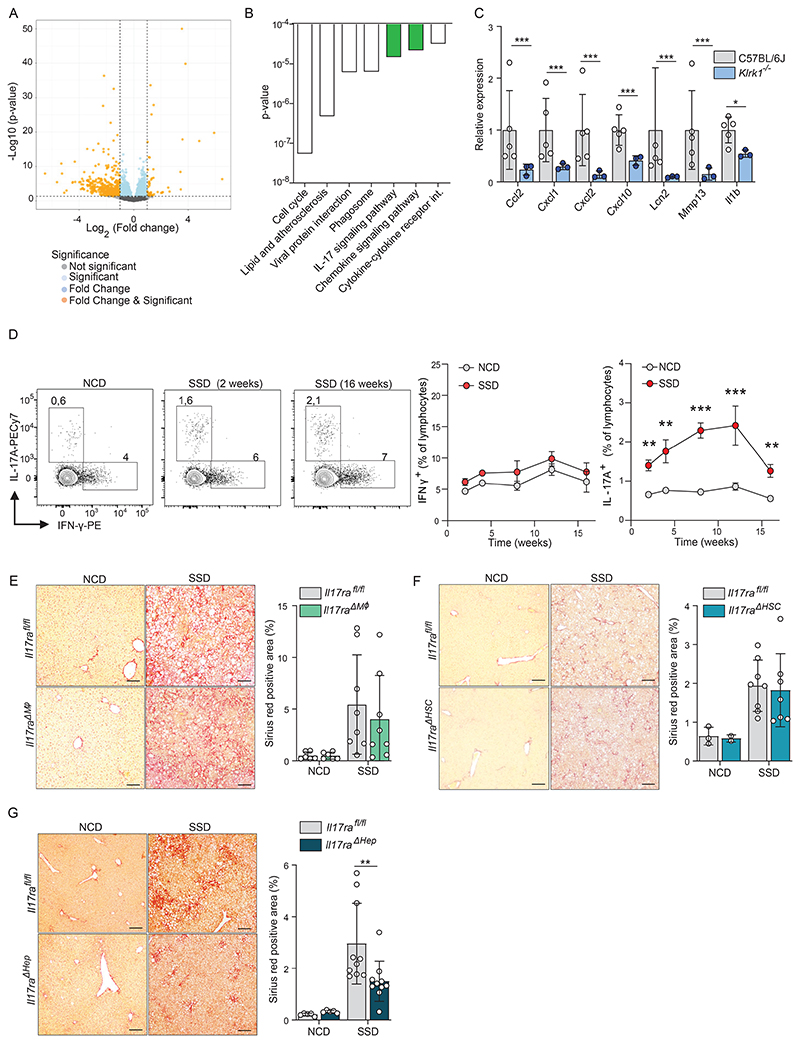
Figure 5. IL-17A signaling to hepatocytes drives liver fibrosis in the context of NASH.
(a-c) WT and Klrk1 -/- mice were fed an SSD for 3 weeks and the total transcriptome of liver tissue was analyzed by RNA sequencing. (a) Volcano plot of genes differentially expressed between WT and Klrk1 -/- mice (n=3-5). (b) Most downregulated KEGG-pathways in Klrk1-/- mice compared to WT controls by p-value. Marked in green are the IL-17A receptor signaling pathway and the chemokine signaling pathway. (c) Differential expression of downstream target genes of the IL-17A receptor signaling pathway. (d) WT mice were fed with an NCD or SSD diet. At indicated time points, liver leukocytes were restimulated in vitro with PMA/Ionomycin and cytokine production was measured by flow cytometry (n = 10). Representative plots are gated for lymphocytes. Numbers represent the percentage of IFN-γ or IL-17A-producing cells. (Right panel) Kinetics of hepatic IFNγ- and IL17A-producing lymphocytes over time. (e) IL17rafl/fl and Lys CreIL7rafl/fl (IL17raΔMφ) littermates were fed an NCD or an SSD diet for 16 weeks. Shown are (left) representative liver slides stained with Sirius Red (200 X) and (right) quantification of fibrosis (n=8). (f) IL17rafl/fl and GFAPCreIL17rafl/fl (IL17raΔHSC) littermates were fed an NCD or an SSD diet for 16 weeks. Shown are (left) representative liver slides stained with Sirius Red (200 X) and (right) quantification of fibrosis (n = 2-7). (g) IL17rafl/fl and AlbuminCre IL17rafl/fl (IL17raΔHep) littermates were fed an NCD or an SSD diet for 16 weeks. Shown are (left) representative liver slides stained with Sirius Red (200 X) and (right) quantification of fibrosis (n = 5). Scale bars indicate 100 µm (e-g). The data are representative of at least two independent experiments or pooled data of at least two experiments (d-g). Shown are means +/-s.e.m. Statistical significance was determined by unpaired t test. Statistical significance was defined as *p<0.05; **p<0.01; ***p<0.001.

