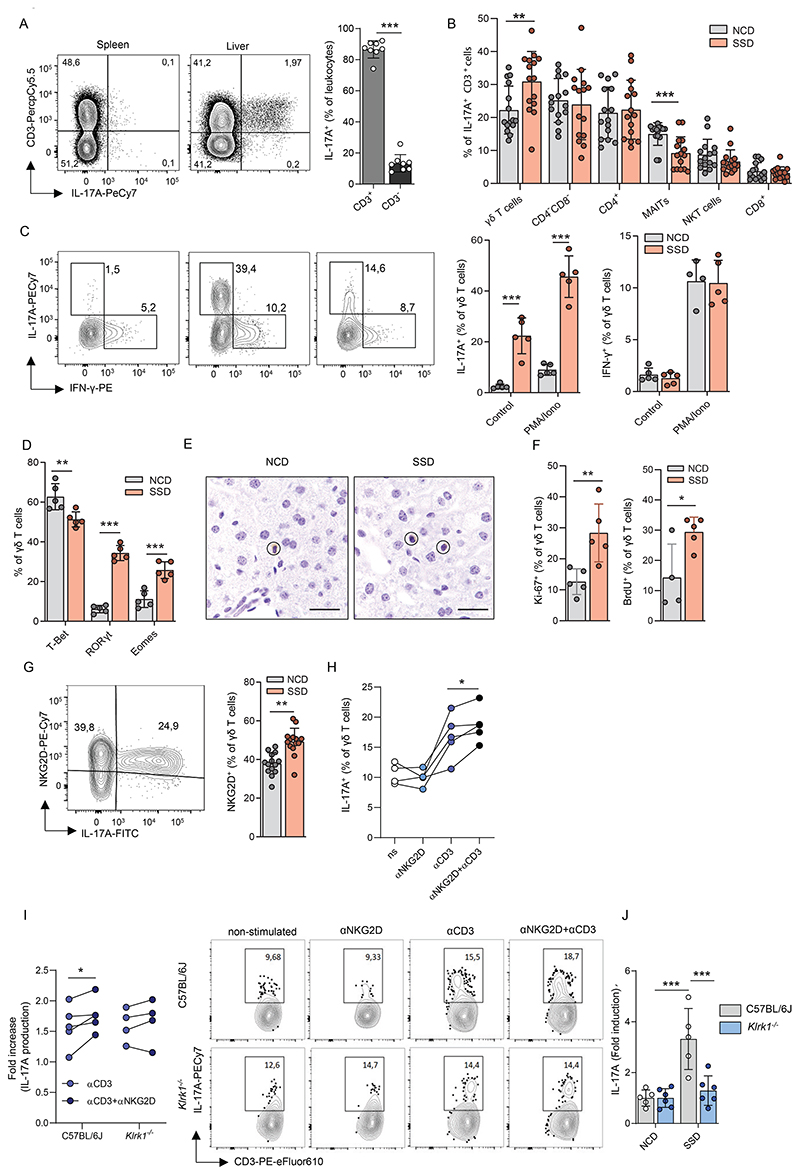
Figure 6. Liver fibrosis in context of NASH is mediated by innate-like T cells.
(a-b) WT mice were fed with an NCD or SSD diet and after 18 days liver leukocytes were restimulated in vitro with PMA/Ionomycin and IL-17A production was quantified by flow cytometry. (a) Fraction of CD3+ and CD3- cells within the IL-17A+ cell pool (n = 8). Representative plots are gated for lymphocytes. (b) Indicated immune cell subsets were quantified within the CD3+IL-17A+ cell pool (n=15). (c) IL-17A and IFN-γ production by hepatic γδ T cells upon in vitro re-stimulation with PMA and ionomycin in WT mice after 2 weeks of NCD or SSD feeding (n = 5). Representative FACS plots are gated for γδ T cells. The number next to the outlined area represents the percentage of IFN-γ- or IL-17A-producing γδ T cells. (d) WT mice were fed an NCD or an SSD diet for 2 weeks and liver resident γδ T cells were analyzed by flow cytometry for expression of transcription factors (n=5). (e) CD3ε staining of Tcra-/- mice after 2 weeks of feeding with NCD or SSD. Scale bars indicate 100 µm. (f) WT mice were fed an NCD or SSD for 2 weeks and for the last 4 days given BrdU in drinking water. Tissue-resident cells were visualized by injecting animals with biotinylated CD45 five minutes before isolation of livers, followed by fluorescent labeling using streptavidin-eFluor780 and analysis by flow cytometry. Tissue-resident cells were defined as eFluor-780-. Ki67+ and BrdU+ hepatic γδ T cells were quantified by flow cytometry (n = 5). (g) Quantification of NKG2D expression on hepatic γδ T cells by flow cytometry of mice fed two weeks with an NCD or SSD (n=14). The representative plot shows γδ T cells after PMA/Ionomycin stimulation. (h-i) Mice were fed an SSD for 2 weeks. Hepatic γδ T cells were restimulated in vitro and IL-17A production was determined by flow cytometry. (h) IL-17A production of γδ T cells after stimulation with αCD3, plate-bound αNKG2D or their combination, measured by flow cytometry. (i) Relative increase of IL-17A production within hepatic γδ T cells from WT or Klrk1-/- mice upon in vitro re-stimulation with αCD3 alone or in combination with plate-bound αNKG2D over non-stimulated γδ T cells (n = 5). Representative FACS plots are gated for γδ T cells. Numbers show percentages of IL-17A-producing γδ T cells (j) WT and Klrk1-/- mice were fed an SSD for 2 weeks. Hepatic γδ T cells were restimulated in vitro with PMA/Ionomycin and IL-17A production was measured by flow cytometry. Shown is the relative increase in IL-17A production within SSD-fed over NCD-fed mice (n=5-6). The data are representative of at least two independent experiments. Shown are means +/- s.e.m. Statistical significance was determined by unpaired t-test (a-g), paired t-test (h-i) and ANOVA with Bonferoni post-testing (j). Statistical significance was defined as *p<0.05; **p<0.01; ***p<0.001.

