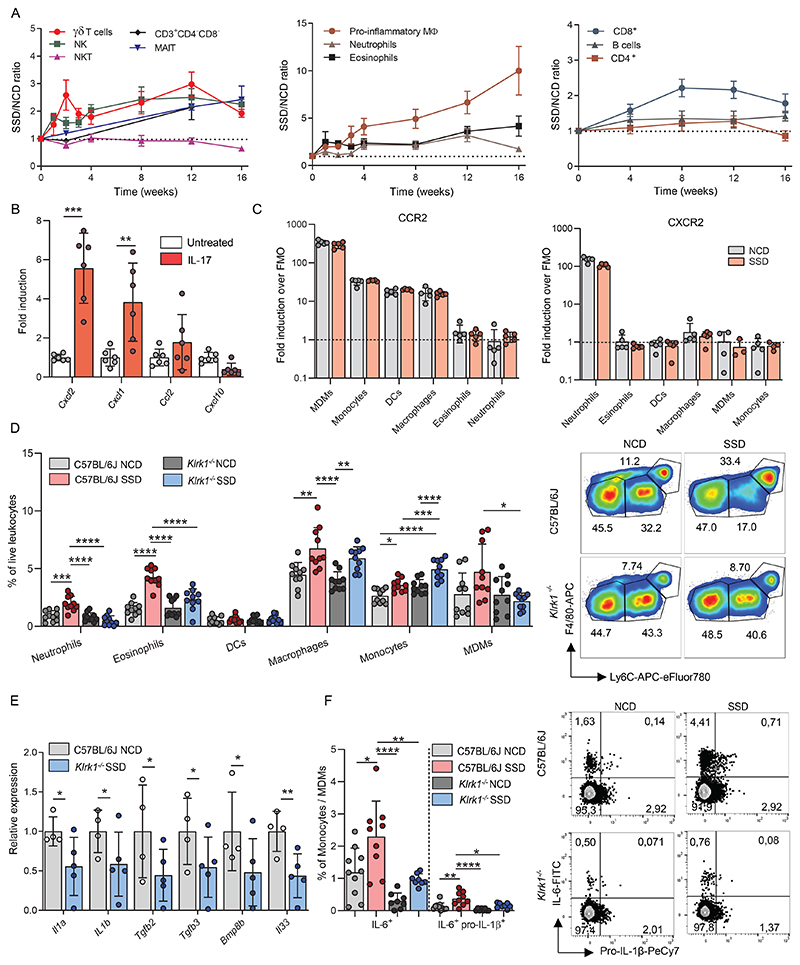
Figure 7. NKG2D mediates myeloid cell recruitment in the context of NASH.
(a) WT mice were fed with an NCD or SSD and at the indicated times hepatic immune cell numbers were quantified by flow cytometry (n=6-10). (b) primary hepatocytes were cultured with or without IL-17A and expression of indicated chemokines was determined by qPCR (n=6). (c) WT mice were fed an NCD or SSD for 4 weeks and the levels of CCR2 and CXCR2 expression on indicated myeloid cell populations were measured by flow cytometry. (d) WT and Klrk1-/- mice were fed for 4 weeks with an NCD or SSD. Hepatic leukocytes of the myeloid lineage were quantified by flow cytometry (n=10). Representative plots are gated for CD11b+F4/80+ cells. (e) WT and Klrk1 -/- mice were fed an SSD for 3 weeks and the total transcriptome of liver tissue was analyzed by RNA sequencing. Expression of indicated genes associated with inflammation (n=3-5). (f) WT and Klrk1-/- mice were fed an SSD for 4 weeks and hepatic leukocytes were restimulated in vitro with PMA/Ionomycin for 4h. Production of indicated cytokines was measured by flow cytometry (n=9-10). Representative FACS plots are gated for monocyte/MDM populations. Numbers represent the percentage of cytokine-producing cells. The data are representative of one experiment using 3-5 biological replicates (e), two pooled experiments (b,d,f) or at least two independent experiments (a,c). Shown are means +/- s.e.m. Statistical significance was determined by ANOVA with Bonferoni post-testing (d,f) or by unpaired t test (a,c,e). Statistical significance was defined as *p<0.05; **p<0.01; ***p<0.001. DCs – Dendritic cells, MDMs – Monocyte-derived macrophages

