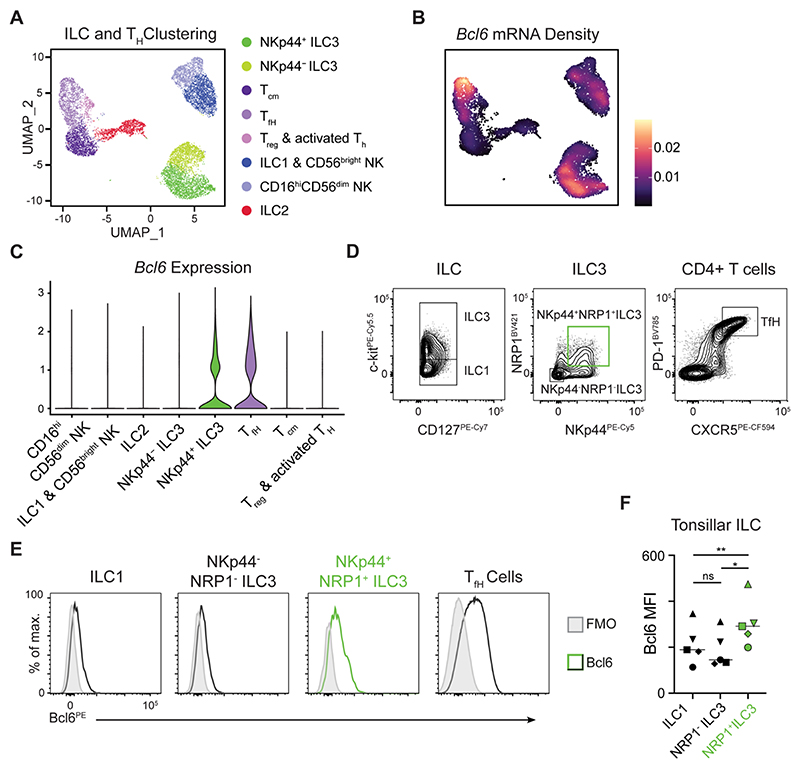
Figure 2. Human tonsillar Nrp1+ NKp44+ ILC3 express Bcl6.
A) UMAP showing ILC and helper T cell clusters and B) Bcl6 mRNA expression density from scRNA seq data generated from human tonsil cells. C) Violin plot summarizing Bcl6 expression from cell clusters (as identified in A). D) Representative flow cytometry gating of ILC subsets (from CD45+ Lin- CD3- CD127+ CRTH2-), ILC3 subsets (from CD45+ Lin- CD3- CD127+ CRTH2- c-kit+) and TfH cells (from Lin- CD3+ CD4+) from the human tonsil. E) Representative histograms and F) geometric mean fluorescence intensity quantification of Bcl6 protein expression from ILC1, NKp44- NRP1- ILC3, NKp44+ NRP3+ ILC3 or control TfH cells from human tonsils, n=5. Statistical significance was determined by a one-way ANOVA with Tukey’s Multiple Comparison test (F). Bars on plot signify median. Data pooled from 2 independent experiments (A-C), or representative of 5 independent donors (D-F). See also Figure S3.

