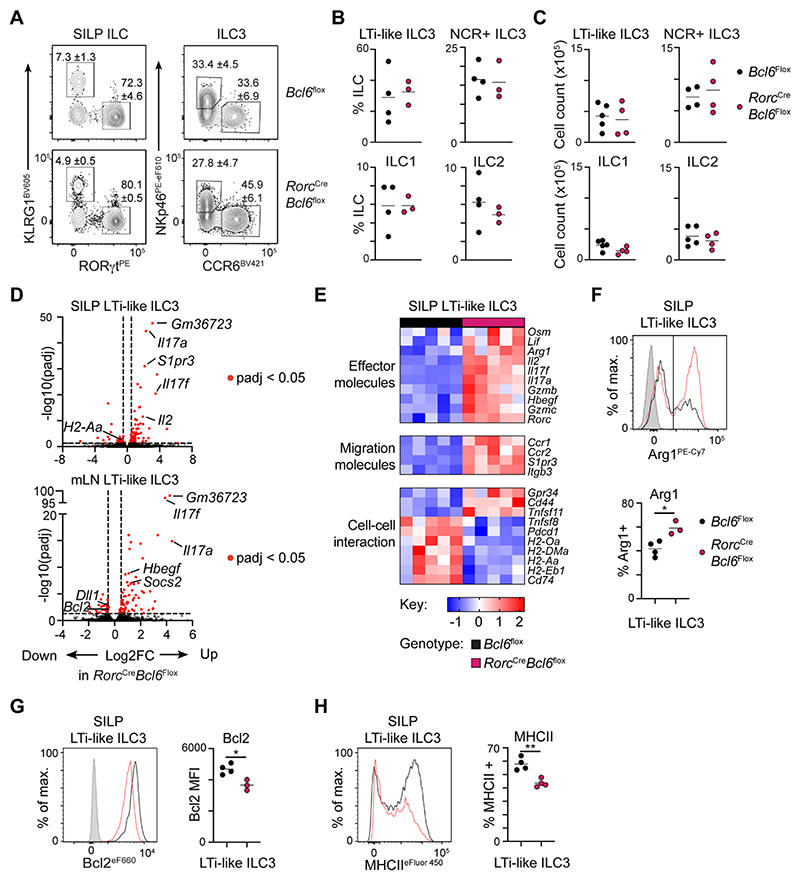
Figure 3. Bcl6 shapes the transcriptional landscape of LTi-like ILC3.
A) Representative flow cytometry plots identifying ILC subsets from the total ILC population (CD45+, CD11b- CD11c- B220- CD3- CD5-, CD127+ CD90.2+). Values indicate average frequency (± standard error of the mean). B) Quantification of ILC subset frequency, n=3-4, C) and absolute cell counts in the SILP of RorcCre x Bcl6fl/fl and Bcl6fl/fl control mice, n=4-5. D) Volcano plot summarizing gene fold change (Log2FC) and adjusted P value (-log10(padj)), between LTi-like ILC3 of RorcCre x Bcl6fl/fl and Bcl6fl/fl control mice in the SILP (top), and mLN (bottom). E) Heatmap summarizing relative expression of curated and significantly differentially expressed genes between LTi-like ILC3 from the SILP of RorcCre x Bcl6fl/fl and Bcl6fl/fl control mice. (F-H) Representative flow cytometry histograms and summary quantification plots of F) Arg1 G) Bcl2 and H) MHCII on LTi-like ILC3 from the SILP from RorcCre x Bcl6fl/fl and Bcl6fl/fl control mice, n=3-4. Data representative of 3-5 independent experiments (A-C, F-H). Statistical significance was determined by an unpaired t-test (F-H). Data represented as individual animals and mean. See also Figure S4 and Figure S5.

