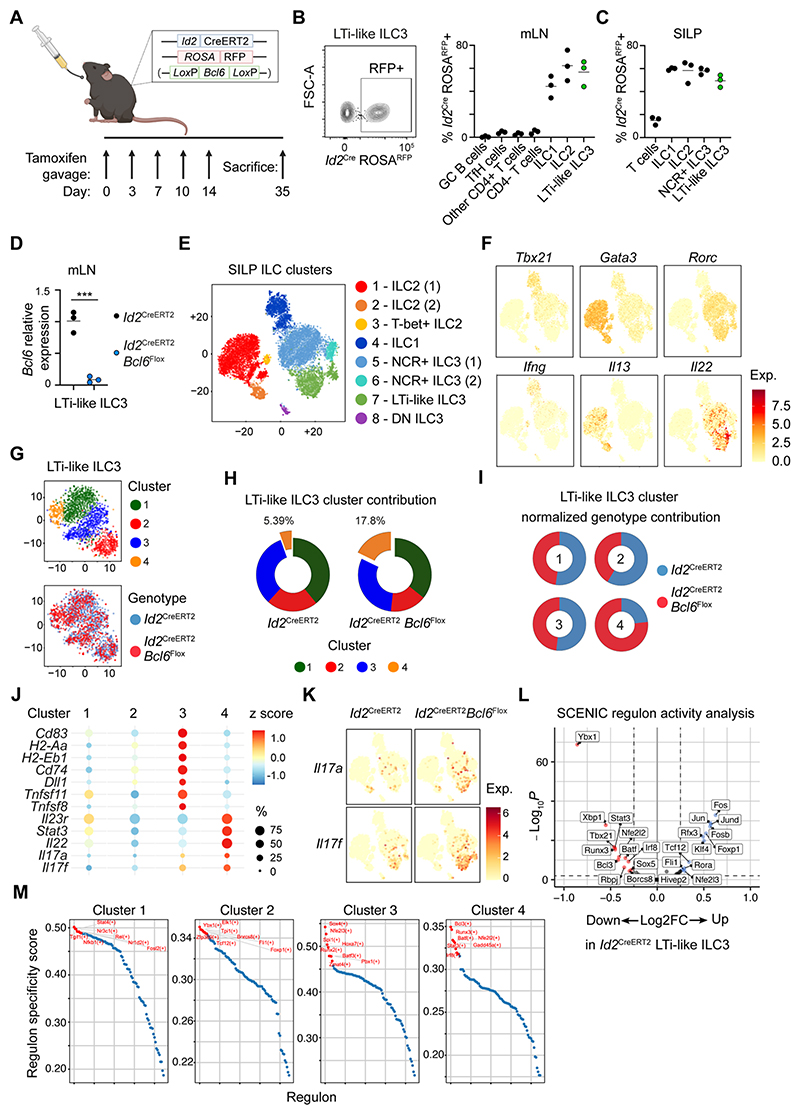
Figure 4. Single cell sequencing of inducible Bcl6-deletion in ILCs.
A) Diagram of experimental design for Cre activation on Id2CreERT2 and Id2CreERT2 x Bcl6fl/fl mice. B) Representative flow cytometry plot (left) and quantification (right) of Id2CreERT2 activation reflected by ROSAtdRFP expression, on lymphocyte subsets from B) the mLN and C) SILP of Id2CreERT2 mice following tamoxifen administration, n=3. D) Relative Bcl6 expression determined by RT-PCR on sort-purified tdRFP+ LTi-like ILC3 from the mLN of Id2CreERT2 and Id2CreERT2 x Bcl6fl/fl mice, n=3. E) t-SNE and cluster identification of ILC single-cell RNAseq from the SILP of Id2CreERT2 and Id2CreERT2 x Bcl6fl/fl mice. F) mRNA expression of subset-defining transcription factors and cytokines related to (E). G) LTi-like ILC3 sub-cluster identification (top) and genotype origin (bottom). H) Relative enrichment of LTi-like ILC3 sub-clusters on Id2CreERT2 and Id2CreERT2 x Bcl6fl/fl mice, and I) relative genotype contribution to each LTi-like ILC3 sub-cluster as identified in (G). J) Dot-plot depicting frequency and normalised gene expression of selected genes across LTi-like ILC3 sub-clusters from (G). K) Il17a and Il17f mRNA expression on total ILCs from Id2CreERT2 and Id2CreERT2 x Bcl6fl/fl mice, clustered as in (E). L) Volcano plot showing fold change (Log2FC) and adjusted P value (-log10(padj)) of regulon activity determined by SCENIC on LTi-like ILC3 from Id2CreERT2 or Id2CreERT2 x Bcl6fl/fl mice. M) Regulon specificity score for each LTi-like ILC3 sub-cluster as identified in (G). Red labels indicate top most specific regulons in each cluster. Data representative of 2-5 independent experiments (B-D). Data represented as individual animals and mean. See also Figure S4 and Figure S6.

