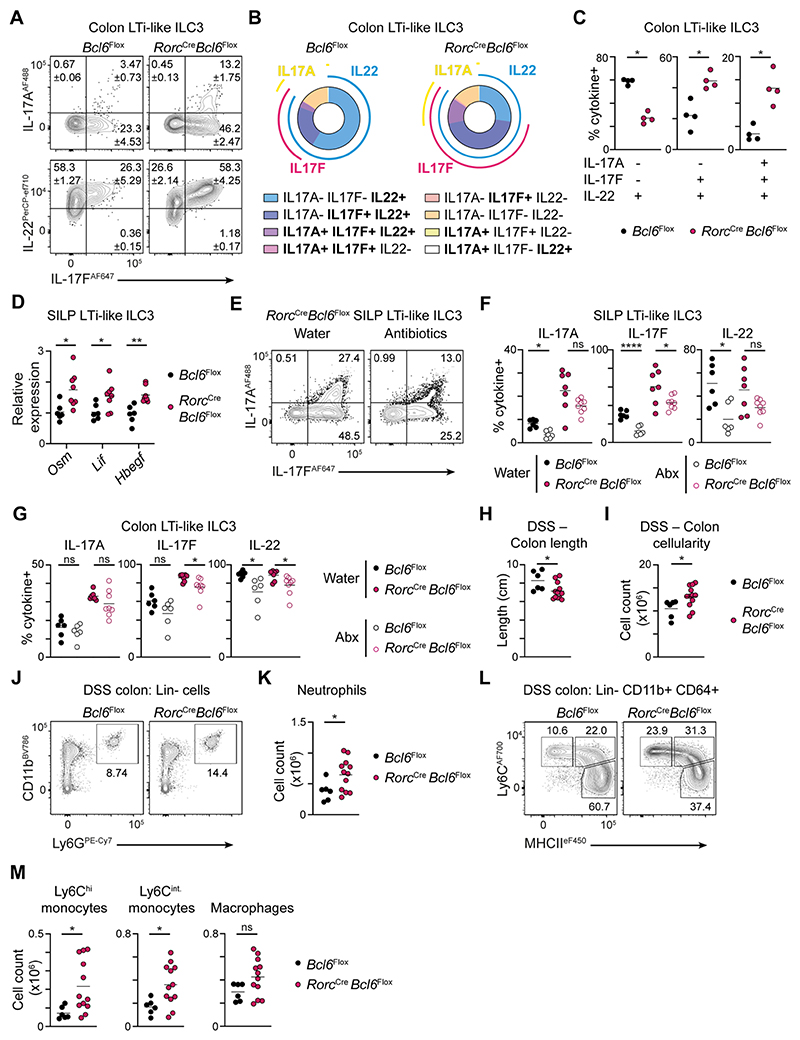
Figure 5. Bcl6 represses type 3 effector cytokine responses to the microbiota.
A) Representative flow cytometry plots showing expression of IL-17A, IL-17F and IL-22 by LTi-like ILC3 from the colon of RorcCre x Bcl6fl/fl and Bcl6fl/fl control mice. B) Pie charts depicting the average percentage of cells co-expressing one or more cytokine within LTi-like ILC3 from the colon of RorcCre x Bcl6fl/fl and Bcl6fl/fl control mice. C) Quantification of single (IL-22+), double (IL-22+ IL-17F+) and triple (IL-22+ IL-17F+ IL-17A+)-secreting LTi-like ILC3 from the colon of RorcCre x Bcl6fl/fl and Bcl6fl/fl control mice, n=4. D) Relative expression of Osm, Lif, and Hbegf mRNA on LTi-like ILC3 sorted from the SILP of RorcCre x Bcl6fl/fl and Bcl6fl/fl control mice, determined by RT-PCR, n=6-8. E) Representative flow cytometry plots showing IL-17A and IL-17F production by LTi-like ILC3 from the SILP of water- or antibiotics-treated RorcCre x Bcl6fl/fl mice. (F-G) Quantification of frequencies of IL-17A, IL-17F and IL-22 producing LTi-like ILC3 from the F) SILP or G) the colon of antibiotics- or water-treated RorcCre x Bcl6fl/fl and Bcl6fl/fl control mice, n=6-8. H) Length and I) absolute cell count of the colon of DSS-treated RorcCre x Bcl6fl/fl and Bcl6fl/fl control mice, n=6-12. J) Representative gating strategy and K) neutrophil cell count in the colon, n=6-12. L) Representative gating strategies and M) cell counts of Ly6Chi monocyte, Ly6Cint monocyte and macrophages in the colon, n=6-12. For myeloid cell analysis (J-M), cells expressing the lineage markers CD3, CD5, NK1.1 and CD19 were excluded. Data representative of 3-4 independent experiments (A-C), or pooled from 2 independent experiments (D-M). Statistical significance was determined using an unpaired Mann-Whitney test (C), unpaired t test (D, H-M), or an ordinary one-way ANOVA (F-G). Values on flow plots indicate average frequency (± standard error of the mean). Data represented as individual animals and mean. See also Figure S7.

