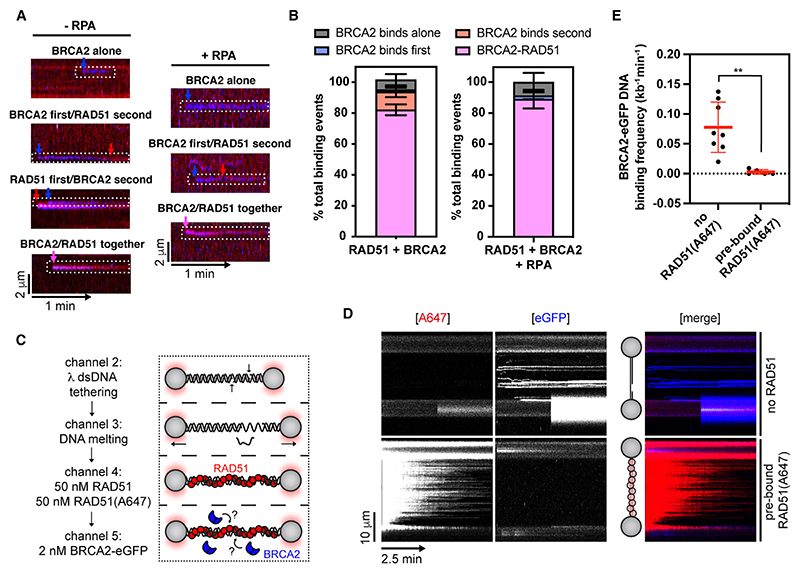
Figure 2. BRCA2 and RAD51 bind to DNA as a complex.
(A) Examples of different orders of binding events observed for BRCA2-eGFP and RAD51(A647).
(B) Quantification of different BRCA2-eGFP/RAD51(A647) binding events in the absence (n = 7 molecules, N = 76 events) or presence (n = 9 molecules, N = 29 events) of 1.25 nM RPA. Error bars represent SEM.
(C) Schematic of RAD51 filament binding experiment, in which λ gDNA was pre-incubated with a 1:1 mixture of labeled and unlabeled RAD51 and then moved to a channel containing BRCA2-eGFP to monitor BRCA2 binding.
(D) Kymographs showing the binding of 2 BRCA2-eGFP (blue) to gDNA or gDNA pre-coated with 50 nM RAD51 and 50 nM RAD51(A647) in the presence of 100 mM NaCl, 2 mM MgCl2, 1 mM CaCl2, and 2 mM ATP held at ~5 pN force. Position of the ssDNA gap is indicated.
(E)Quantification of BRCA2 binding frequencies on λ gDNA or λ gDNA pre-coated with RAD51. Lines represent mean. Error bars represent SD. p values by Student’s t test. n.s., p > 0.05; *p ≤ 0.05; **p ≤ 0.01. See also Figure S2.

