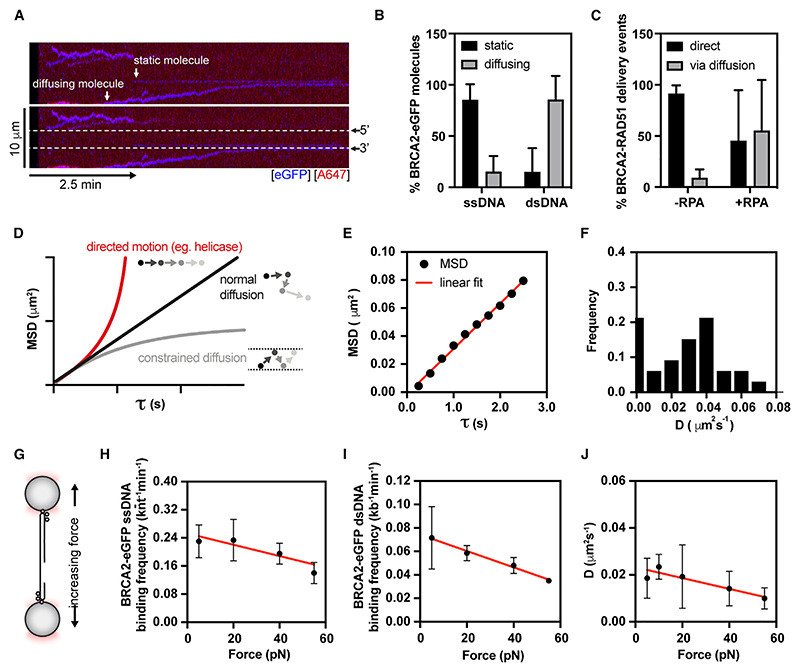
Figure 4. BRCA2 moves along dsDNA arms via normal diffusion.
(A) A representative kymograph showing diffusion-driven delivery of BRCA2-RAD51 complexes to ssDNA in the vicinity of the ds-ssDNA junction. Static BRCA2-eGFP molecules bound directly to the ssDNA gap or mobile BRCA2-eGFP molecules diffusing along dsDNA are indicated by arrows. 25 nM RAD51(A466) (red) was incubated with gDNA in the presence of 5 nM BRCA2-eGFP (blue) and 1.25 nM RPA in the presence of 5 nM SYTOX Orange. Position of the ssDNA gap is indicated by dashed lines.
(B) Fraction of diffusive or static BRCA2-eGFP molecules on ss-(n = 9) or dsDNA (n = 15). Error bars represent SD.
(C) Relative contribution of diffusion-assisted RAD51 delivery to RAD51 accumulation at the ssDNA gap in the presence (n = 15) or absence of RPA (n = 10). Error bars represent SD.
(D) Mean square displacement (MSD) as a function of tau to estimate the mode of particle movement from the shape of the curve.
(E) An example of MSD analysis of a moving BRCA2-eGFP molecule on dsDNA showing a linear relationship/normal diffusion.
(F) Diffusion coefficient (D) calculated from MSD analysis for BRCA2-RAD51 complexes moving on dsDNA. 2 nM BRCA2-eGFP, 20 nM RAD51(A647), 10 pN force, 25 mM NaCl, 2 mM MgCl2, and 2 mM ATP. Bin size = 0.01 mm2s−1. N = 33 molecules.
(G) Schematic of the force-pulling experiment, where the position of an optical trap is changed to exert tension on gDNA.
(H) ssDNA-binding frequency of BRCA2-eGFP as a function of force. 2 nM BRCA2-eGFP, 20 nM RAD51(A647). 100 mM NaCl, 2 mM MgCl2, 1 mM CaCl2, and 2 mM ATP. Red line represents linear regression. Error bars represent SEM. n = 2–6 molecules.
(I) dsDNA-binding frequency of BRCA2-eGFP as a function of force. 2 nM BRCA2-eGFP, 20 nM RAD51(A647). 100 mM NaCl. Red line represents linear regression. Error bars represent SEM. n = 3–6 molecules.
(J) Diffusion coefficient of BRCA2-eGFP as a function of force. 2 nM BRCA2-eGFP, 20 nM RAD51(A647). 50 mM NaCl, 2 mM MgCl2, and 2 mM ATP. Red line represents linear regression. Error bars represent SEM. N = 36–50 molecules. See also Figure S3.

