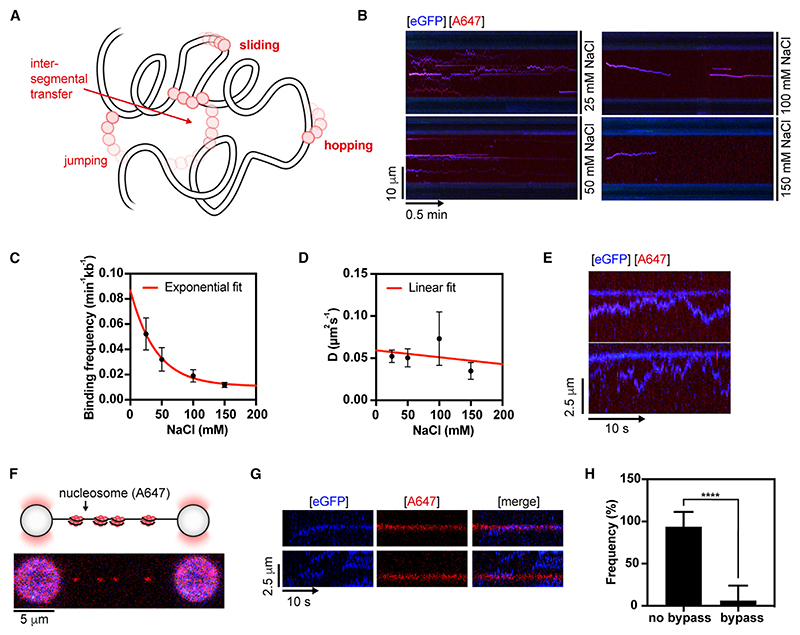
Figure 5. BRCA2 moves by sliding along dsDNA backbone.
(A) Target search models for DNA-binding proteins. Increasing ionic strength increases the diffusion coefficient during hopping but not sliding.
(B) Representative kymographs demonstrating diffusion of BRCA2-RAD51 complex along λ dsDNA at 10 pN at the indicated salt concentrations. 2 nM BRCA2-eGFP (blue), 20 nM RAD51(A647) (red).
(C) Binding frequency (n = 9–11) calculated for BRCA2-RAD51 complexes as a function of salt concentration. Error bars represent SEM.
(D) Corrected diffusion coefficient (N = 8–24, exclusion of fraction in 0.01 mm2s−1 bin) calculated for BRCA2-RAD51 complexes as a function of salt concentration. Error bars represent SEM.
(E) Representative kymographs demonstrating collision between fast-moving and slow-moving BRCA2-RAD51 complex along λ dsDNA held at 10 pN force. 2 nM BRCA2-eGFP (blue), 20 nM RAD51(A647) (red), 50 mM NaCl, 2 mM MgCl2, and 2 mM ATP.
(F) Sparsely chromatinized λ DNA substrate (F = 5 pN). Nucleosomes are fluorescently labeled on H4-E63C with Alexa Fluor 647.
(G) Representative kymographs showing BRCA2/RAD51 complex collisions with labeled nucleosomes. 2 nM BRCA2-eGFP (blue), 20 nM RAD51 (dark), labeled nucleosomes in red. F = 5 pN. 50 mM NaCl, 2 mM MgCl2, and 2 mM ATP.
(H) Frequency of collision outcomes for BRCA2-eGFP/RAD51 complexes with labeled nucleosomes on individual chromatinized γ DNA molecules (n = 8). BRCA2 cannot bypass a nucleosome barrier, indicating a tight association with dsDNA during sliding. Error bars represent SD. p values by Student’s t test. n.s., p > 0.05; *p ≤ 0.05; **p ≤ 0.01; ***p ≤ 0.001; ****p ≤ 0.0001. See also Figure S4.

