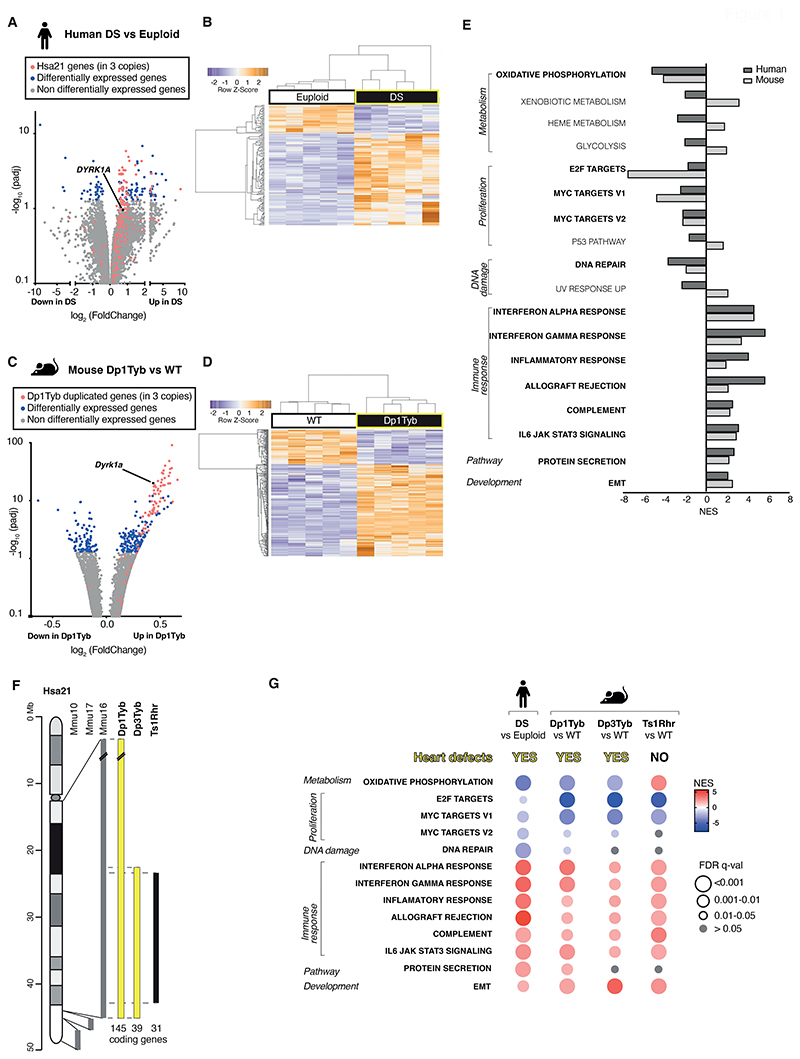
Figure 1. Transcriptomic similarities in embryonic hearts from human fetuses with DS and mouse models of DS.
(A, B) RNAseq analysis of human DS and euploid embryonic hearts (13-14 post-conception weeks, n=5), showing (A) a volcano plot of fold-change in gene expression (DS versus euploid) against adjusted P-value for significance of the difference, showing Hsa21 genes (red), differentially expressed genes (blue), and DYRK1A (black) (B) unsupervised hierarchical clustering of the 10 samples showing heatmap of differentially expressed genes (C, D) RNAseq analysis of E13.5 hearts from WT and Dp1Tyb embryos (n=5) showing (C) a volcano plot as in A, indicating genes in 3 copies in Dp1Tyb mice (red), differentially expressed genes (blue), and Dyrk1a (black) and (D) hierarchical clustering of the samples as in B. (E) Hallmark gene sets from the Molecular Signatures Database that are significantly enriched or depleted (GSEA, ≤5% FDR) in both human DS and Dp1Tyb mouse hearts; NES, normalized enrichment scores. Gene sets showing the same direction of change in human and mouse data are indicated in bold. (F) Map of Hsa21 (length in Mb) showing cytogenetic bands and regions of orthology to Mmu10, Mmu17 and Mmu16 (grey) and indicating regions of Mmu16 that are duplicated in mouse strains (bold) that show CHD (yellow) and that do not (black); numbers of coding genes indicated below duplicated regions. (G) Comparison of dysregulated gene sets determined by GSEA of RNAseq data from human DS versus euploid embryonic hearts and in hearts from Dp1Tyb, Dp3Tyb and Ts1Rhr mouse embryos compared to WT controls. All show heart defects except Ts1Rhr mice. Colors and sizes of circles indicate NES and FDR q-value, respectively.

