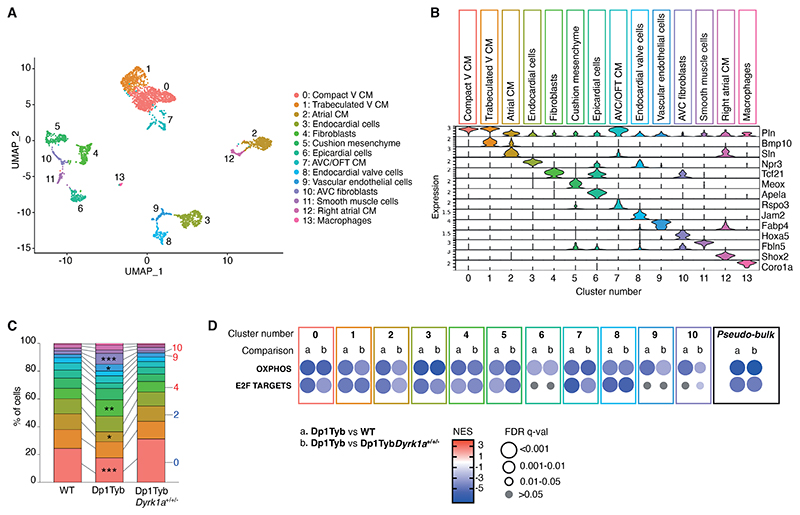
Figure 2. scRNAseq reveals similar gene expression changes across different cell types in Dp1Tyb mouse embryonic hearts.
(A) Uniform Manifold Approximation and Projection (UMAP) clustering of scRNAseq data pooled from WT, Dp1Tyb and Dp1TybDyrk1a+/+/- E13.5 mouse hearts. Each dot represents a single cell; colors indicate 14 clusters whose identity was inferred based on expression of markers genes. V, ventricular; CM, cardiomyocytes; AVC, atrioventricular canal; OFT, outflow tract. (B) Violin plots showing the expression of representative marker genes across the 14 clusters; Y-axis shows the log-scale normalized read count. (C) Stacked column plot showing the percentage of cells in each of the 14 cell populations, colored according to cluster designation. Clusters with significantly altered percentages in Dp1Tyb hearts compared to WT are indicated; Fisher's exact test, * 0.01 < P < 0.05, ** 0.001 < P < 0.01, *** P < 0.001. (D) GSEA of Dp1Tyb versus WT (a) or Dp1Tyb versus Dp1TybDyrk1a+/+/- (b) scRNAseq data from the 11 most abundant clusters analyzed individually and pooled (pseudo-bulk), showing key pathways and their NES. Colors and sizes of circles indicate NES and FDR q-value, respectively. Sample numbers: n=2 WT, 1 Dp1Tyb, 2 Dp1TybDyrk1a+/+/- embryonic hearts.

