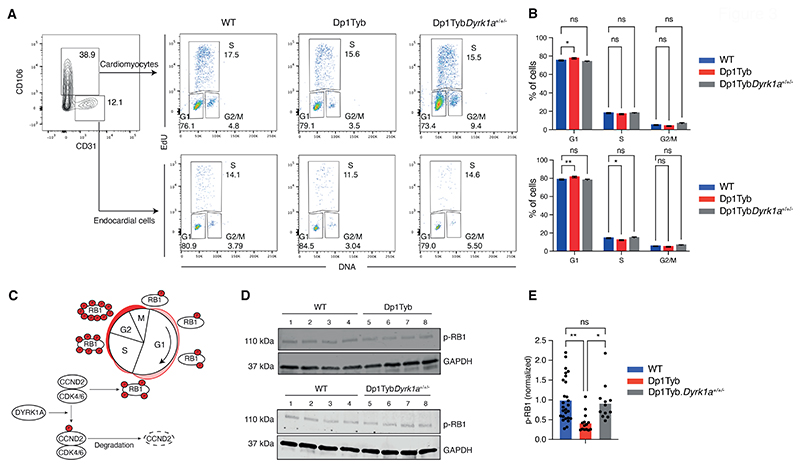
Figure 3. Proliferative defects in Dp1Tyb embryonic hearts.
(A) Flow cytometric analysis of freshly isolated embryonic mouse hearts pulsed with EdU. EdU and DNA content of cardiomyocytes (CD106+CD31-) and endocardial cells (CD106- CD31+) were used to distinguish cells in G1, S and G2/M phases. Numbers indicate percentage of cells in gates. (B) Mean (±SEM) percentage of cells in each cell cycle phase taken from data as in A. n=38 WT, 14 Dp1Tyb, 12 Dp1TybDyrk1a+/+/- embryonic mouse hearts. (C) Diagram showing how DYRK1A may regulate the cell cycle. Cyclin D2 (CCND2) in complex with CDK4/6 phosphorylates RB1 promoting cell cycle progression. DYRK1A phosphorylates CCND2 leading to its degradation thereby causing reduced CDK4/6 activity, reduced RB1 phosphorylation and impaired cell cycle progression. (D) Representative immunoblot analysis of lysates from WT, Dp1Tyb and Dp1TybDyrk1a+/+/- E13.5 embryonic hearts probed with antibodies to phospho-RB1 (p-RB1) and GAPDH. Each lane represents an individual embryonic heart. (E) Mean p-RB1 abundance determined by immunoblots such as those in D, normalized to GAPDH and to the mean of WT samples which was set to 1. Dots represent individual embryos. n=27 WT, 14 Dp1Tyb, 12 Dp1TybDyrk1a+/+/- embryonic hearts. Statistical significance was calculated using a Kruskal-Wallis test; * 0.01 < P < 0.05, ** 0.001 < P < 0.01; ns, not significant.

