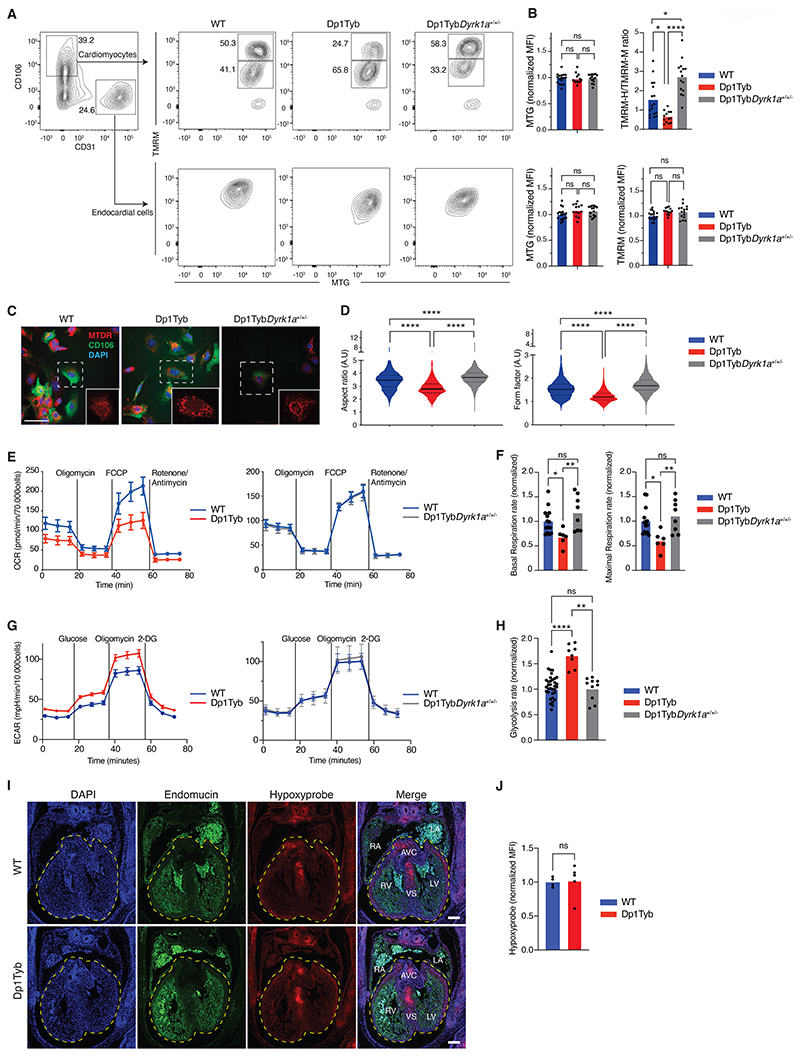
Figure 4. Mitochondrial defects in Dp1Tyb mouse embryonic cardiomyocytes.
(A) Flow cytometric analysis showing gating strategy used to measure mitochondrial mass (MTG) and mitochondrial potential (TMRM) in cardiomyocytes (CD106+CD31-) and endocardial cells (CD106-CD31+) from E13.5 mouse embryonic hearts of the indicated genotypes. Cardiomyocytes were subdivided into cells that have a high (TMRM-H) and medium (TMRM-M) potential. Numbers indicate percentage of cells in gates. (B) Mean fluorescence intensity (MFI) of MTG and TMRM in endocardial cells and of MTG in cardiomyocytes normalized to the average of WT samples which was set to 1. For cardiomyocytes mitochondrial potential was measured using a TMRM-H/TMRM-M ratio. Dots represent individual embryos. n=17 WT, 13 Dp1Tyb, 15 Dp1TybDyrk1a+/+/- embryonic hearts. (C) Representative confocal microscopy images of cells from E13.5 mouse hearts of the indicated genotypes showing staining with MitoTracker Deep Red (MTDR – mitochondria, red), anti-CD106 (cardiomyocytes, green) and DAPI (blue). Images show a maximum projection of Z-stacks from 0 to 3 μm with a step size of 1 μm. Insets are enlarged images of the region in the dashed square showing the mitochondrial network. Scale bar 50 μm. (D) Violin plots of mitochondrial aspect ratio and form factor in cardiomyocytes (CD106+) determined from images such as those in C (fig. S3A, B). Aspect ratio and form factor are measures of distortion from circularity and degree of branching, respectively (54). Black lines indicate median, dotted lines indicate 25th and 75th centiles. n=25 WT, 10 Dp1Tyb, 17 Dp1TybDyrk1a+/+/- mouse embryonic hearts. (E) Mean±SEM oxygen consumption rate (OCR) in E13.5 mouse heart cells from embryos of the indicated genotypes analyzed using a Seahorse analyzer with oligomycin (ATP synthase inhibitor), FCCP (depolarizes mitochondrial membrane potential), and rotenone and antimycin (complex I and III inhibitors) added at the indicated times. Basal respiration rate was calculated from the mean of the first three measurements, maximal respiration rate from the three time points after addition of FCCP. (F) Mean basal and maximal respiration rates of E13.5 mouse heart cells normalized to the mean rates in WT hearts. Dots represent individual embryos. n=14 WT, 6 Dp1Tyb, 8 Dp1TybDyrk1a+/+/- embryonic hearts. (G) Mean±SEM extracellular acidification rate (ECAR) in E13.5 mouse heart cells from embryos of the indicated genotypes analyzed using a Seahorse analyzer with glucose, oligomycin (ATP synthase inhibitor) and 2 deoxy-glucose (2-DG, competitive inhibitor of glucose) added at the indicated times. Glycolysis rate was calculated as the difference between the mean ECAR of the three measurements before and after glucose injection. (H) Mean glycolysis rates of E13.5 mouse heart cells normalized to the mean rates in WT hearts. Dots represent individual embryos. n=35 WT, 8 Dp1Tyb, 10 Dp1TybDyrk1a+/+/- embryonic hearts. (I) Representative images of sections of E13.5 mouse hearts of the indicated genotypes showing a 4-chamber view stained with anti-Endomucin (endothelial cells, green), anti-Hypoxyprobe (hypoxia, red) and DAPI (blue). Dashed line indicates a region of interest (ROI) encompassing the ventricles and the atrioventricular cushions. Scale bar 200 μm. (J) MFI of anti-Hypoxyprobe in ROI determined from images such as those in I. n=4 WT, 6 Dp1Tyb mouse embryonic hearts. Dots represent individual embryos. LV, left ventricle; RV, right ventricle; LA, left atrium; RA, right atrium; AVC, atrioventricular cushion; VS, ventricular septum. Statistical significance was calculated using a Kruskal-Wallis (B, D, F, H) or Mann Whitney test (J), * 0.01 < P < 0.05, ** 0.001 < P < 0.01, **** P < 0.0001; ns, not significant.

