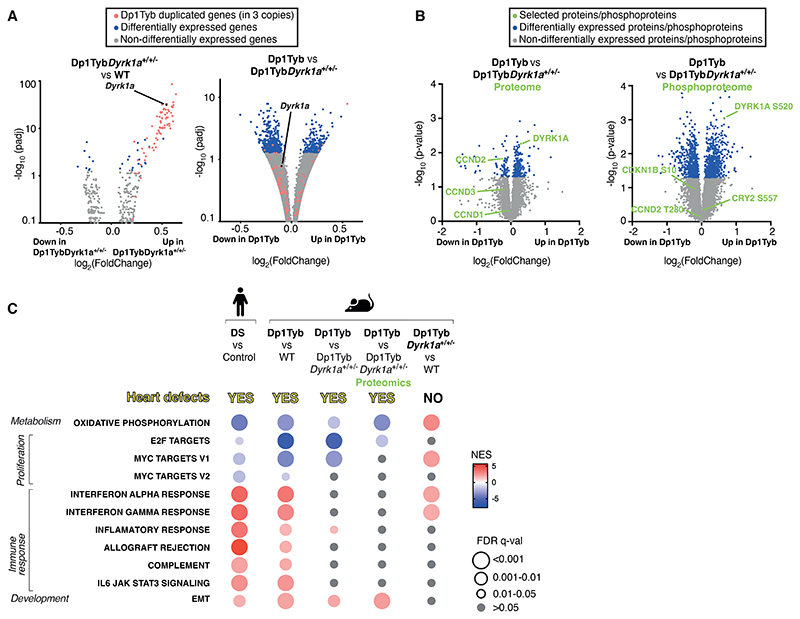
Figure 6. Increased dosage of Dyrk1a causes key transcriptional changes in Dp1Tyb mouse embryonic hearts.
(A) Volcano plots showing fold-change in gene expression in E13.5 mouse embryonic hearts, Dp1TybDyrk1a+/+/- versus WT (left) and Dp1Tyb versus Dp1TybDyrk1a+/+/- (right), plotted against adjusted P-value for significance of the difference. Genes present in three copies in Dp1Tyb mice (red) and differentially expressed genes (blue) and Dyrk1a (black) are indicated. (B) Volcano plots showing fold-change in abundance of proteins and phosphorylated sites in Dp1Tyb versus Dp1TybDyrk1a+/+/- E13.5 hearts. DYRK1A, CCND1, CCND2 and CCND3 are indicated in green on the proteome plot (left); phosphorylated sites known to be DYRK1A targets and an autophosphorylation site on DYRK1A are indicated in green on the phosphoproteome plot (right). (C) Comparison of dysregulated pathways determined by GSEA of RNAseq and proteomic experiments. Colors and sizes of circles indicate NES and FDR q-value, respectively. Sample numbers: n=5 embryonic hearts.

