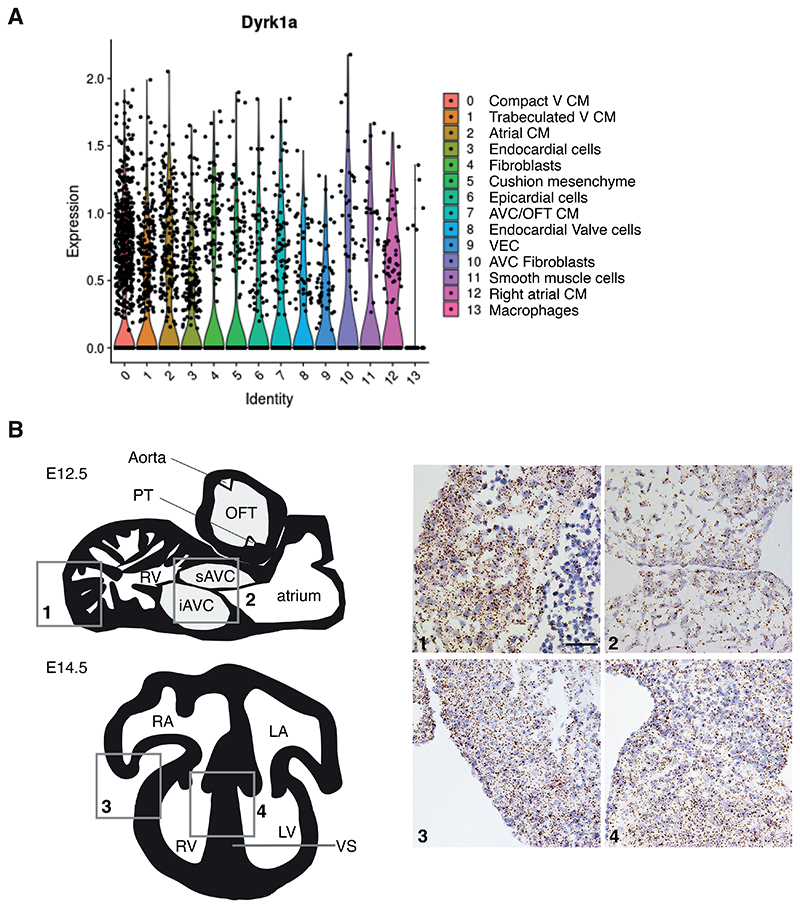
Figure 7. Dyrk1a expression in a broad range of cell types in the developing mouse heart.
(A) Violin plots showing expression of Dyrk1a in mouse E13.5 hearts across 14 cell clusters identified in Fig. 2B. Dots indicate single cells. Sample numbers: n=5 embryonic hearts. (B) Left, schematic illustrations of a sagittal section (top) of an E12.5 mouse heart and a 4-chamber view (bottom) of an E14.5 heart. Right, RNAscope analysis of Dyrk1a expression (brown dots) in sections of the right ventricle myocardial wall (1) and atrioventricular cushions (2) at E12.5 and right ventricular myocardial wall (3) and ventricular septum (4) at E14.5; sections were counterstained with hematoxylin (blue). Scale bar 50 μm. iAVC, inferior atrioventricular cushion; LA, left atrium; LV, left ventricle; OFT, outflow tract; PT, pulmonary trunk; RA, right atrium; RV, right ventricle; sAVC, superior atrioventricular cushion; VS, ventricular septum.

