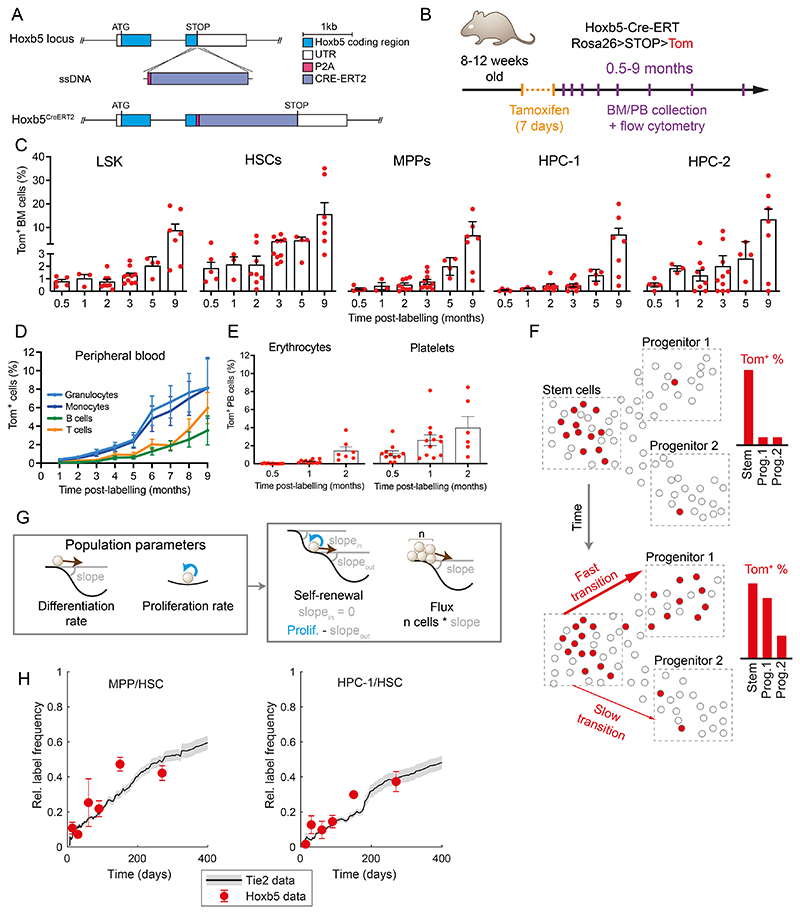
Figure 1. Hoxb5-Tom persistent labelling system enables time-resolved tracking of stem cells and their progeny.
(A) Diagram of the genetic construct used to introduce the inducible and persistent Hoxb5-Tom label in the respective mouse line. (B) Schematic of the time-course experiment analyzing Hoxb5-Tom label frequency in the indicated populations of mouse bone marrow (BM) and peripheral blood (PB). Upon tamoxifen administration, Hoxb5-expressing cells are labelled with heritable Tom expression. (C) Fractions of Tom+ cells in the HSPC subpopulations within the BM at indicated time-points after label induction. Mice were analyzed at 0.5 (n=5), 1 (n=3), 2 (n=8), 3 (n=10), 5 (n=4) and 9 (n=7) months after label induction. Dots represent individual mice and bars indicate mean ± SEM. (D, E) Fractions of Tom+ cells in peripheral blood of lymphoid/myeloid cells (D) and erythrocytes/platelets (E) analyzed at the indicated time-points after label induction. Shown as mean with error bars denoting SEM of 4-32 animals. (F) Diagram portraying the concept of inferring population dynamics from heritable label propagation. The rate of label accumulation in the downstream compartments is proportional to the differentiation rate between the compartments. (G) Diagrams providing analogy between the shape of the Waddington landscape and the key population parameters estimated in this work: differentiation rate is akin to the slope of the landscape; self-renewal (and related residence time or half-life) depend on the input, output and proliferation; flux the number of cells multiplied by the slope. (H) Comparison of Tie2-YFP and Hoxb5-Tom label progression displayed as relative labelling frequency between MPP or HPC-1 and HSC compartments. Red dots - Hoxb5-Tom data points (see Figure 2), grey line - rolling average for matching Tie2-YFP data, as published previously22. LSK – Lin-, Sca1+, cKit+; HSCs – LSK, CD150+, CD48-; MPP – LSK, CD150-, CD48-; HPC-1 – LSK, CD150-, CD48+; HPC-2 – LSK, CD150+, CD48+ cells.

