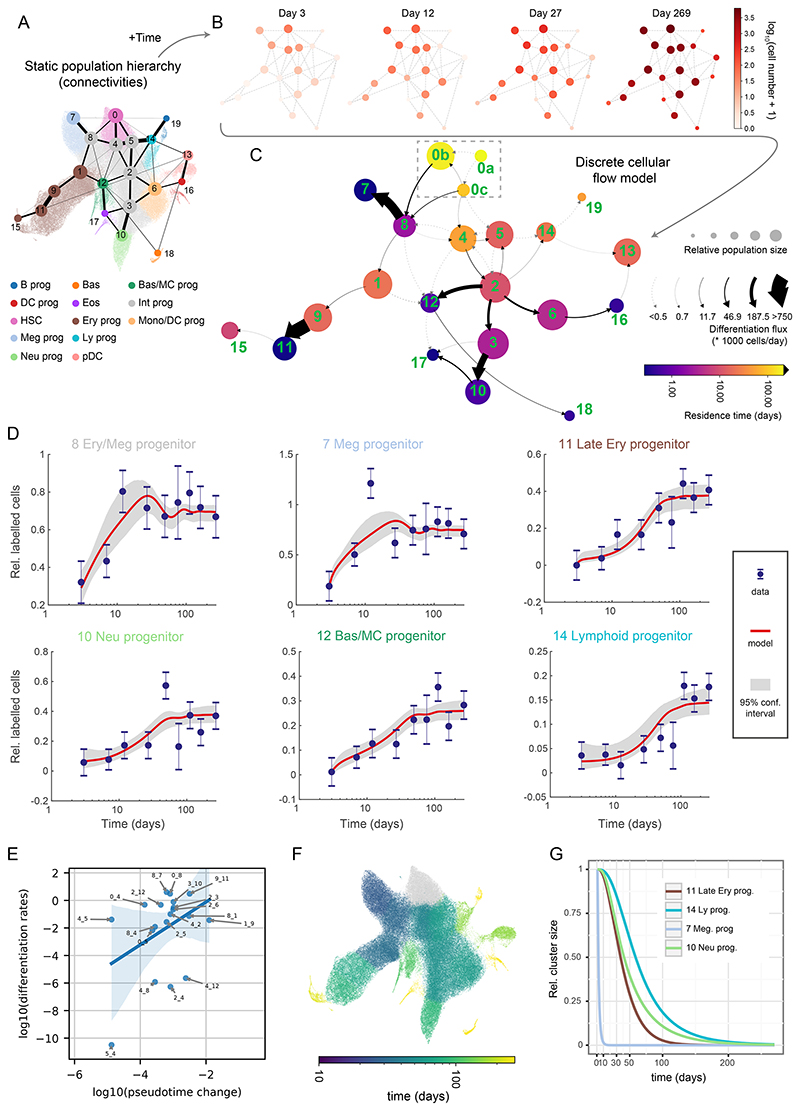
Figure 3. Quantitative discrete model of the HSPCs highlights progenitor-specific self-renewal and differentiation properties.
(A) Annotated UMAP projection overlaid with PAGA graph abstraction view of the HSPC landscape. The graph shows putative transitions between clusters (related to Figure 2B). (B) The absolute number of labelled cells observed in each cluster over time displayed as a graph view from A. 4 out of 9 time-points are shown for clarity. (C) Graph abstraction view of the discrete cellular flow model. Size of the nodes is proportional to square roots of relative cluster size, node color is proportional to the residence time (log-scale), arrows indicate differentiation directions, arrow stem thickness is proportional to cell flux. Note: cluster 0a is fully self-renewing and thus exhibits infinite residence time. (D) Best discrete model fit (with 95% confidence intervals) for Tom+ cell number in chosen clusters relative to cluster 0. Error bars indicate pooled standard error of the mean. (E) Scatter plot showing relation of pseudotime distance to differentiation rates, each point corresponding to a transition between clusters. Only transitions among clusters 0-12 and differentiation rates greater than 10-12 are shown. Please note that in the case of the transitions between clusters 4 and 8 two differentiation rates are plotted (each direction). Blue line indicates linear model fit with shaded 95% confidence interval. (F) UMAP projection of the HSPC landscape, with cells color-coded by simulated time required for 1 cell to accumulate in the corresponding cluster starting from cluster 0. Please mind that the color is logarithm-scaled. (G) Simulated relative cluster size of chosen clusters following complete ablation of cluster 0.

