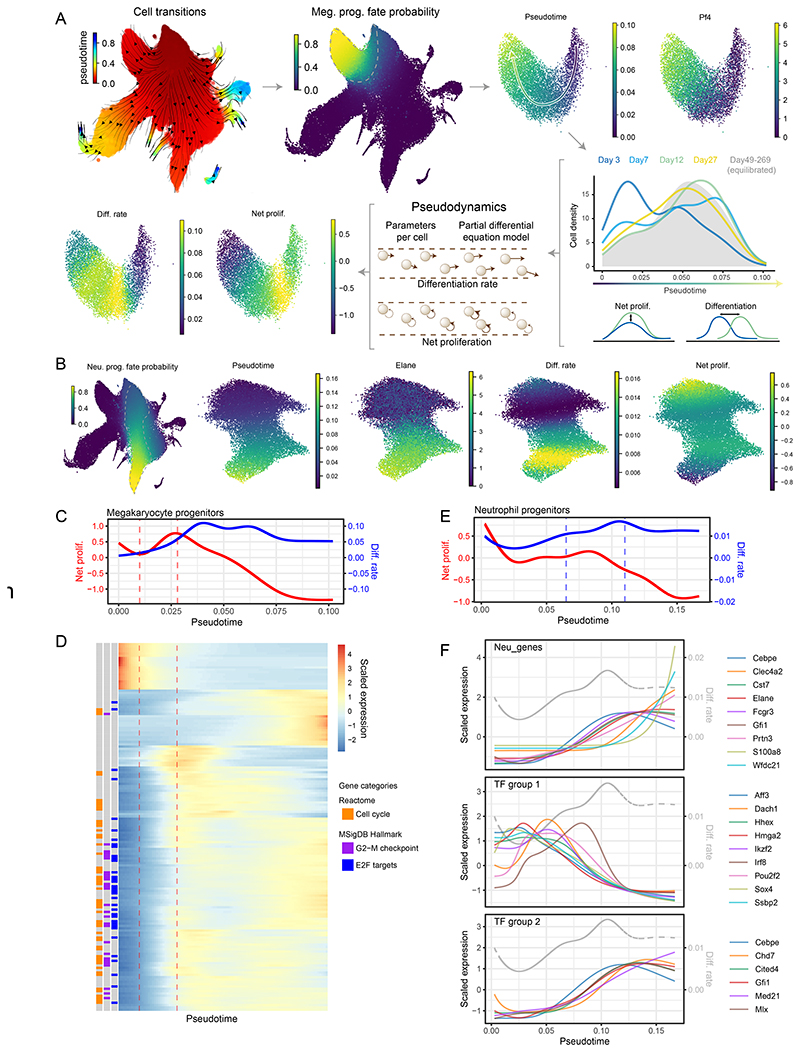
Figure 4. Continuous models capture single cell growth and differentiation rates alongside their molecular state.
(A) Diagrammatic representation of megakaryocyte trajectory analysis with pseudodynamics. Following the arrows: putative cell transitions (pseudotime kernel) were used to estimate megakaryocyte cell fate, from which megakaryocyte trajectory was isolated (dashed line). Along the pseudotime cell densities were computed for each time-point (color-coded density profiles) and analyzed using the pseudodynamics framework providing differentiation and net proliferation rate estimates for each cell. (B) (left) UMAP projection of the HSPC landscape color-coded by cell fate probability of neutrophil lineage (estimated with pseudotime kernel, see A). Panels on the right show UMAP projections of isolated neutrophil trajectory color-coded by indicated parameters or gene expression. (C) Pseudodynamics fitted net proliferation parameter (red) and differentiation rate parameters (blue) along pseudotime for megakaryocyte trajectory. Vertical lines indicate the region of interest with increasing proliferation. (D) Heatmap of genes differentially expressed around the region of interest shown in C. Left columns indicate genes belonging to enriched gene categories - E2F target (FDR <10-38), G2-M checkpoint (FDR <10-24) and cell cycle (FDR <10-38). (E) Pseudodynamics fitted net proliferation (red) and differentiation rate (blue) parameters along pseudotime for neutrophil trajectory. Vertical lines indicate the region of interest with increasing differentiation. (F) Fitted gene expression values along pseudotime for neutrophil markers and two TF groups shown in (full analysis in Figure E10). Grey, dashed line indicated differentiation rates shown in E. Gene expression was scaled around the mean.

