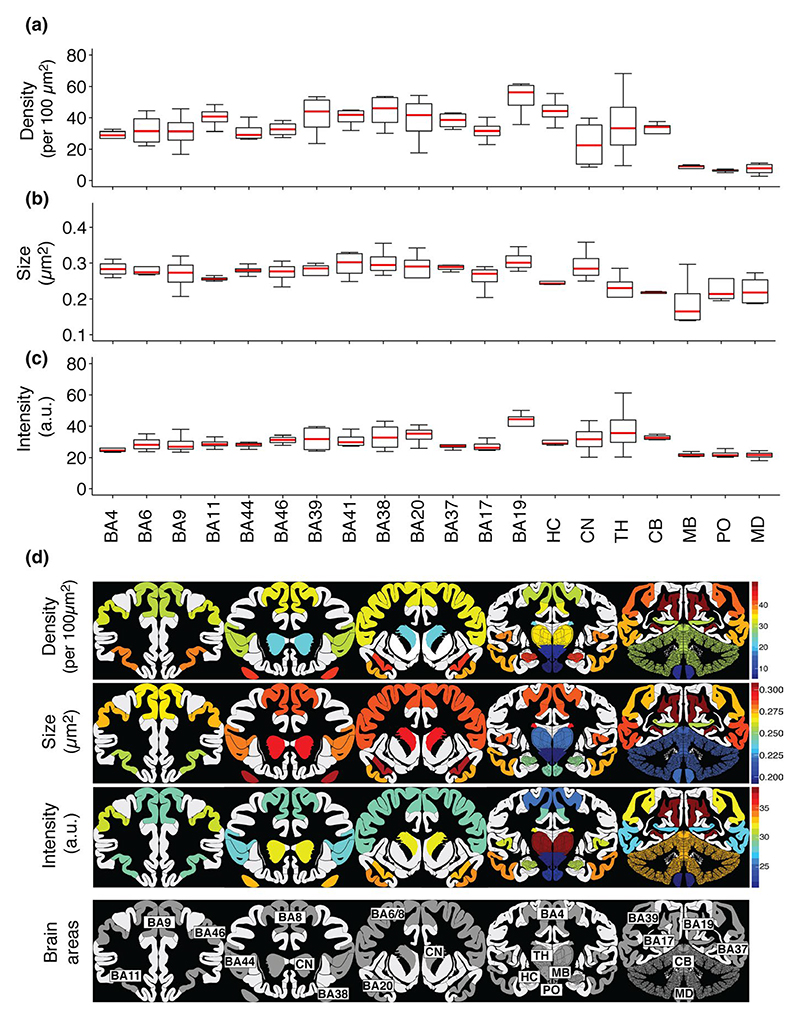
Figure 7. Quantification of PSD95 in 20 human brain areas.
(a–c) Boxplots showing quantification of PSD95 puncta density (per 100 μm2) (a), size (μm2) (b) and intensity (a.u.) (c) in 20 human brain areas from four control cases. (d) Colour-coded PSD95 synaptome map based on quantifications of parameters. BA, Brodmann area; CB, cerebellum; CN, caudate nucleus; HC, hippocampus; MB, midbrain; MD, medulla; PO, pons; TH, thalamus

