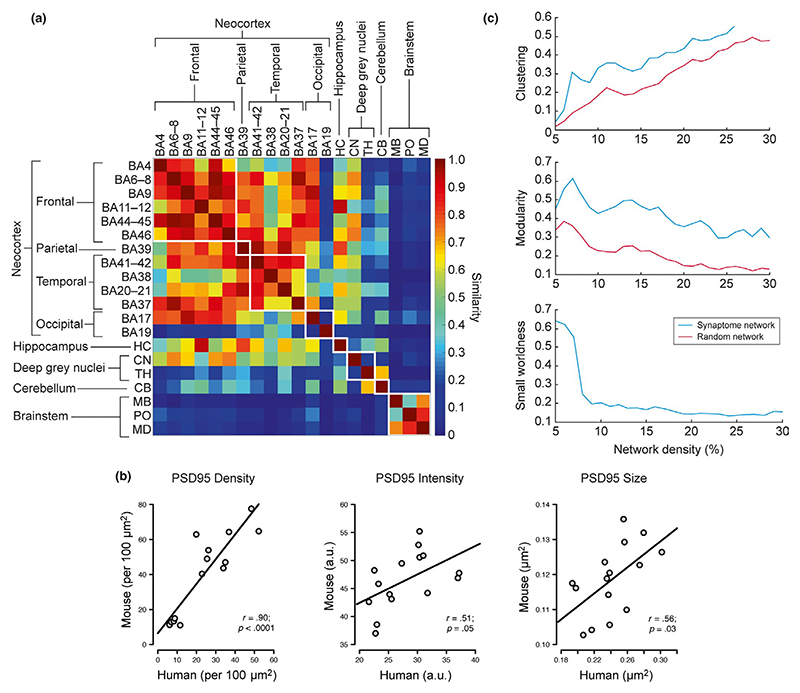
Figure 8. Mapping of PSD95 at whole brain scale.
(a) Similarity matrix between pairs of the 20 human brain regions examined (rows and columns). (b) Correlation of PSD95 puncta parameters between human and mouse. Scatterplots show correlations of PSD95 immunofluorescent puncta parameters (density, intensity and size) quantified from 15 brain areas of PSD95-EGFP knock-in mouse and human tissue stained using PSD95 antibody. A positive, linear and significant correlation was found for PSD95 puncta density, intensity and size between the two species. Pearson's product-moment correlation (r) and p values are provided, based on three male WT mice aged 12 months and three male human controls. (c) PSD95 network topology. Clustering coefficient, modularity, and small-worldness of the PSD95 network and random network

