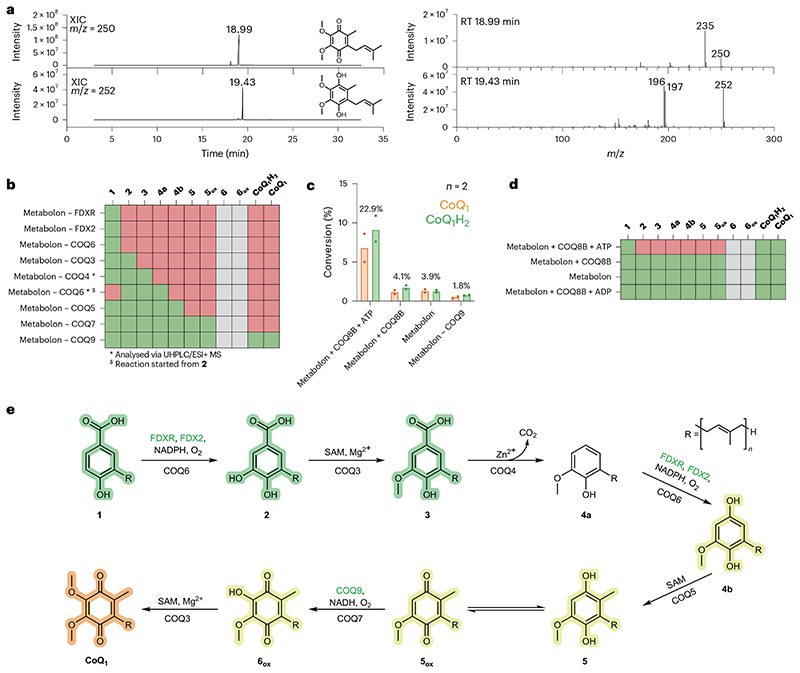
Fig. 6 |. The in vitro reconstituted COQ metabolon is regulated COQ8B.
a, GC/MS analysis of the overnight COQ metabolon transformation reaction of 1 to CoQ1(H2). The XICs and full-scan mass spectra of CoQ1 and CoQ1H2 recorded from the reaction mixture are shown. XIC and full-scan mass spectra of 500 ppm analytical standard are reported in Fig. 5d,e. RT, retention time. b, Hit map showing detected (green) and undetected (red) CoQ1 biosynthesis intermediates after overnight COQ metabolon reaction. Intermediates for which an analytical standard was not available are depicted in grey. Individual COQ proteins or activators were removed one at a time (Supplementary Fig. 9). c, Percentage of conversion of 1 in CoQ1, either in the reduced (green) or oxidized (orange) form, in different conditions (Supplementary Figs. 10 and 11). d, Hit map showing the intermediates detected after conversion in the presence or absence of COQ8B and ATP or ADP. e, Vertebrate CoQ biosynthetic pathway in light of the findings of this work. p-Hydroxybenzoic acid derivatives are highlighted in green, immature hydroquinones in yellow and the final product in orange. COQ proteins responsible of each ring decoration step are reported below the arrow, co-substrates, metals and ancillary proteins (green) above. Individual data points corresponding to n = 2 independent measurements are shown in c. The bars of the histogram show the mean value of independent replicates.

